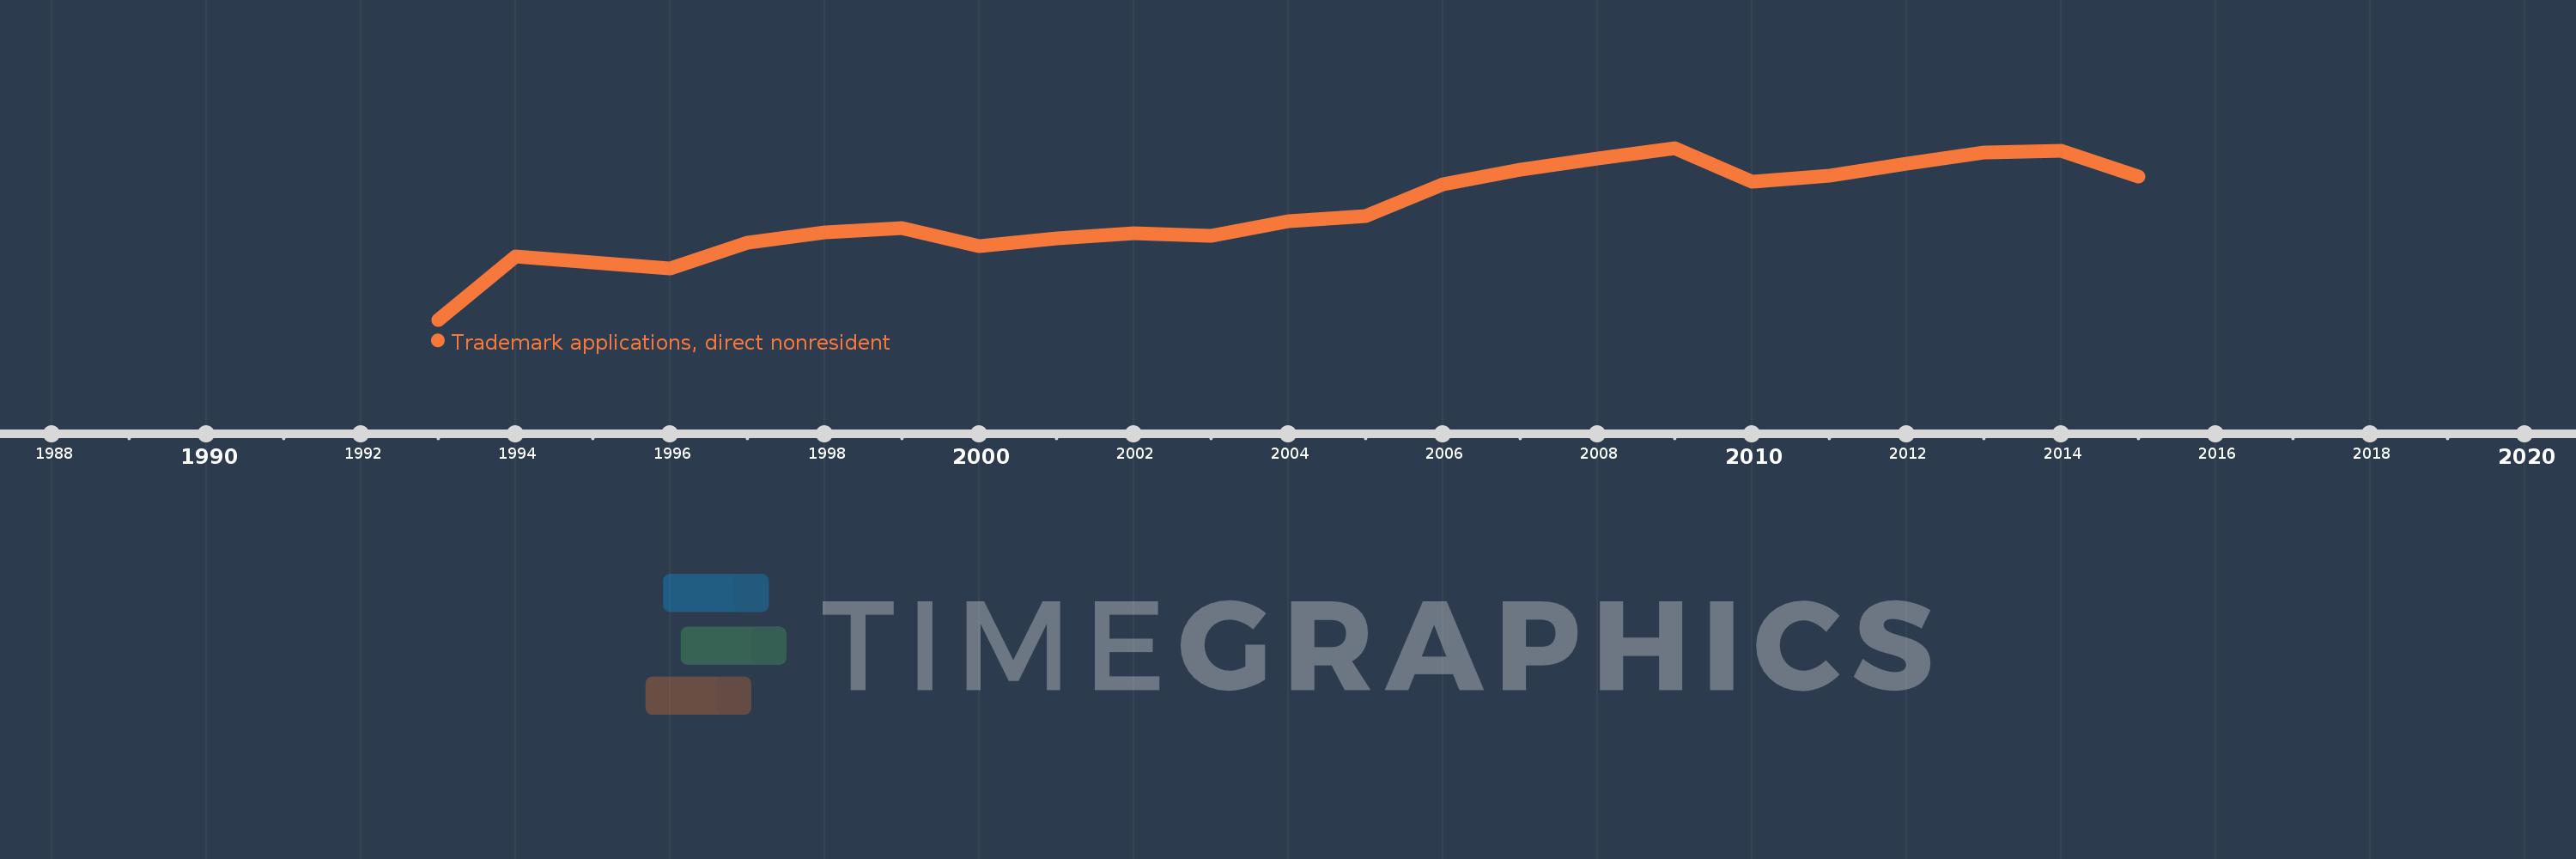
This timeline shows a graph from 1993 to 2015 of Ukraine. No data until 1992. Number of actual observations by date: 22.
Source name:
World Development Indicators
Source organization:
World Intellectual Property Organization (WIPO), WIPO Patent Report: Statistics on Worldwide Patent Activity. The International Bureau of WIPO assumes no responsibility with respect to the transformation of these data.
Categories, topics:
Science & Technology
Last updated:
apr 23, 2017
Indicators value changes by year
Meaning:
9.37K
Minimum:
56.0
jan 1, 1993
Maximum:
14.523K
jan 1, 2009
At the date of observation
Value
Absolute change
Change from the previous value
jan 1, 1993
56.0
+56.0
0.0%
jan 1, 1994
5.381K
+5.325K
9.51K%
jan 1, 1996
4.362K
-1.019K
-18.94%
jan 1, 1997
6.525K
+2.163K
49.59%
jan 1, 1998
7.381K
+856.0
13.12%
jan 1, 1999
7.778K
+397.0
5.38%
jan 1, 2000
6.26K
-1.518K
-19.52%
jan 1, 2001
6.893K
+633.0
10.11%
jan 1, 2002
7.32K
+427.0
6.19%
jan 1, 2003
7.093K
-227.0
-3.1%
jan 1, 2004
8.364K
+1.271K
17.92%
jan 1, 2005
8.803K
+439.0
5.25%
jan 1, 2006
11.469K
+2.666K
30.29%
jan 1, 2007
12.715K
+1.246K
10.86%
jan 1, 2008
13.624K
+909.0
7.15%
jan 1, 2009
14.523K
+899.0
6.6%
jan 1, 2010
11.69K
-2.833K
-19.51%
jan 1, 2011
12.204K
+514.0
4.4%
jan 1, 2012
13.165K
+961.0
7.87%
jan 1, 2013
14.126K
+961.0
7.3%
jan 1, 2014
14.313K
+187.0
1.32%
jan 1, 2015
12.102K
-2.211K
-15.45%
Ranking of countries by current statistics by years