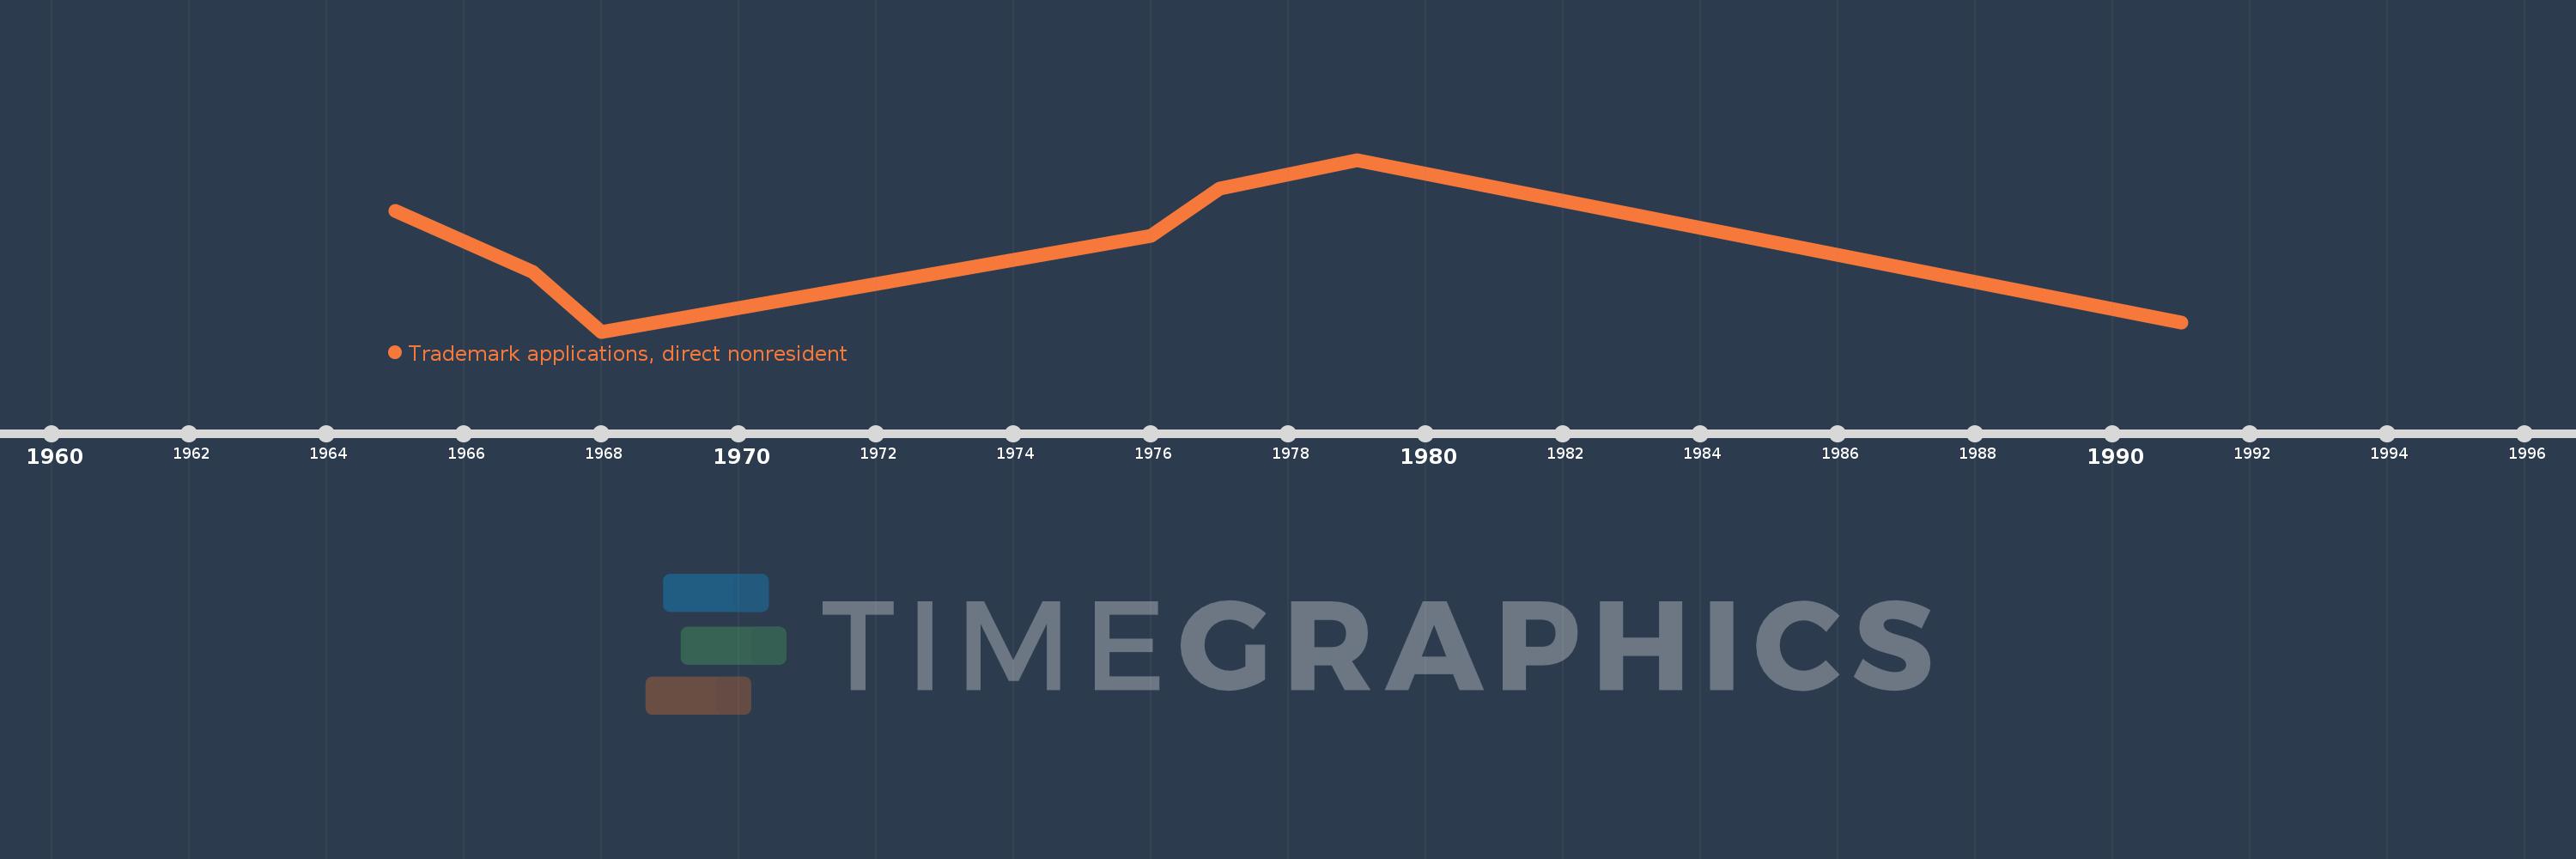
This timeline shows a graph from 1965 to 1991 of Nigeria. No data until 1964. Number of actual observations by date: 7.
Source name:
World Development Indicators
Source organization:
World Intellectual Property Organization (WIPO), WIPO Patent Report: Statistics on Worldwide Patent Activity. The International Bureau of WIPO assumes no responsibility with respect to the transformation of these data.
Categories, topics:
Science & Technology
Last updated:
apr 23, 2017
Indicators value changes by year
Meaning:
1.047K
Minimum:
564.0
jan 1, 1968
Maximum:
1.532K
jan 1, 1979
At the date of observation
Value
Absolute change
Change from the previous value
jan 1, 1965
1.243K
+1.243K
0.0%
jan 1, 1967
900.0
-343.0
-27.59%
jan 1, 1968
564.0
-336.0
-37.33%
jan 1, 1976
1.106K
+542.0
96.1%
jan 1, 1977
1.369K
+263.0
23.78%
jan 1, 1979
1.532K
+163.0
11.91%
jan 1, 1991
614.0
-918.0
-59.92%
Ranking of countries by current statistics by years