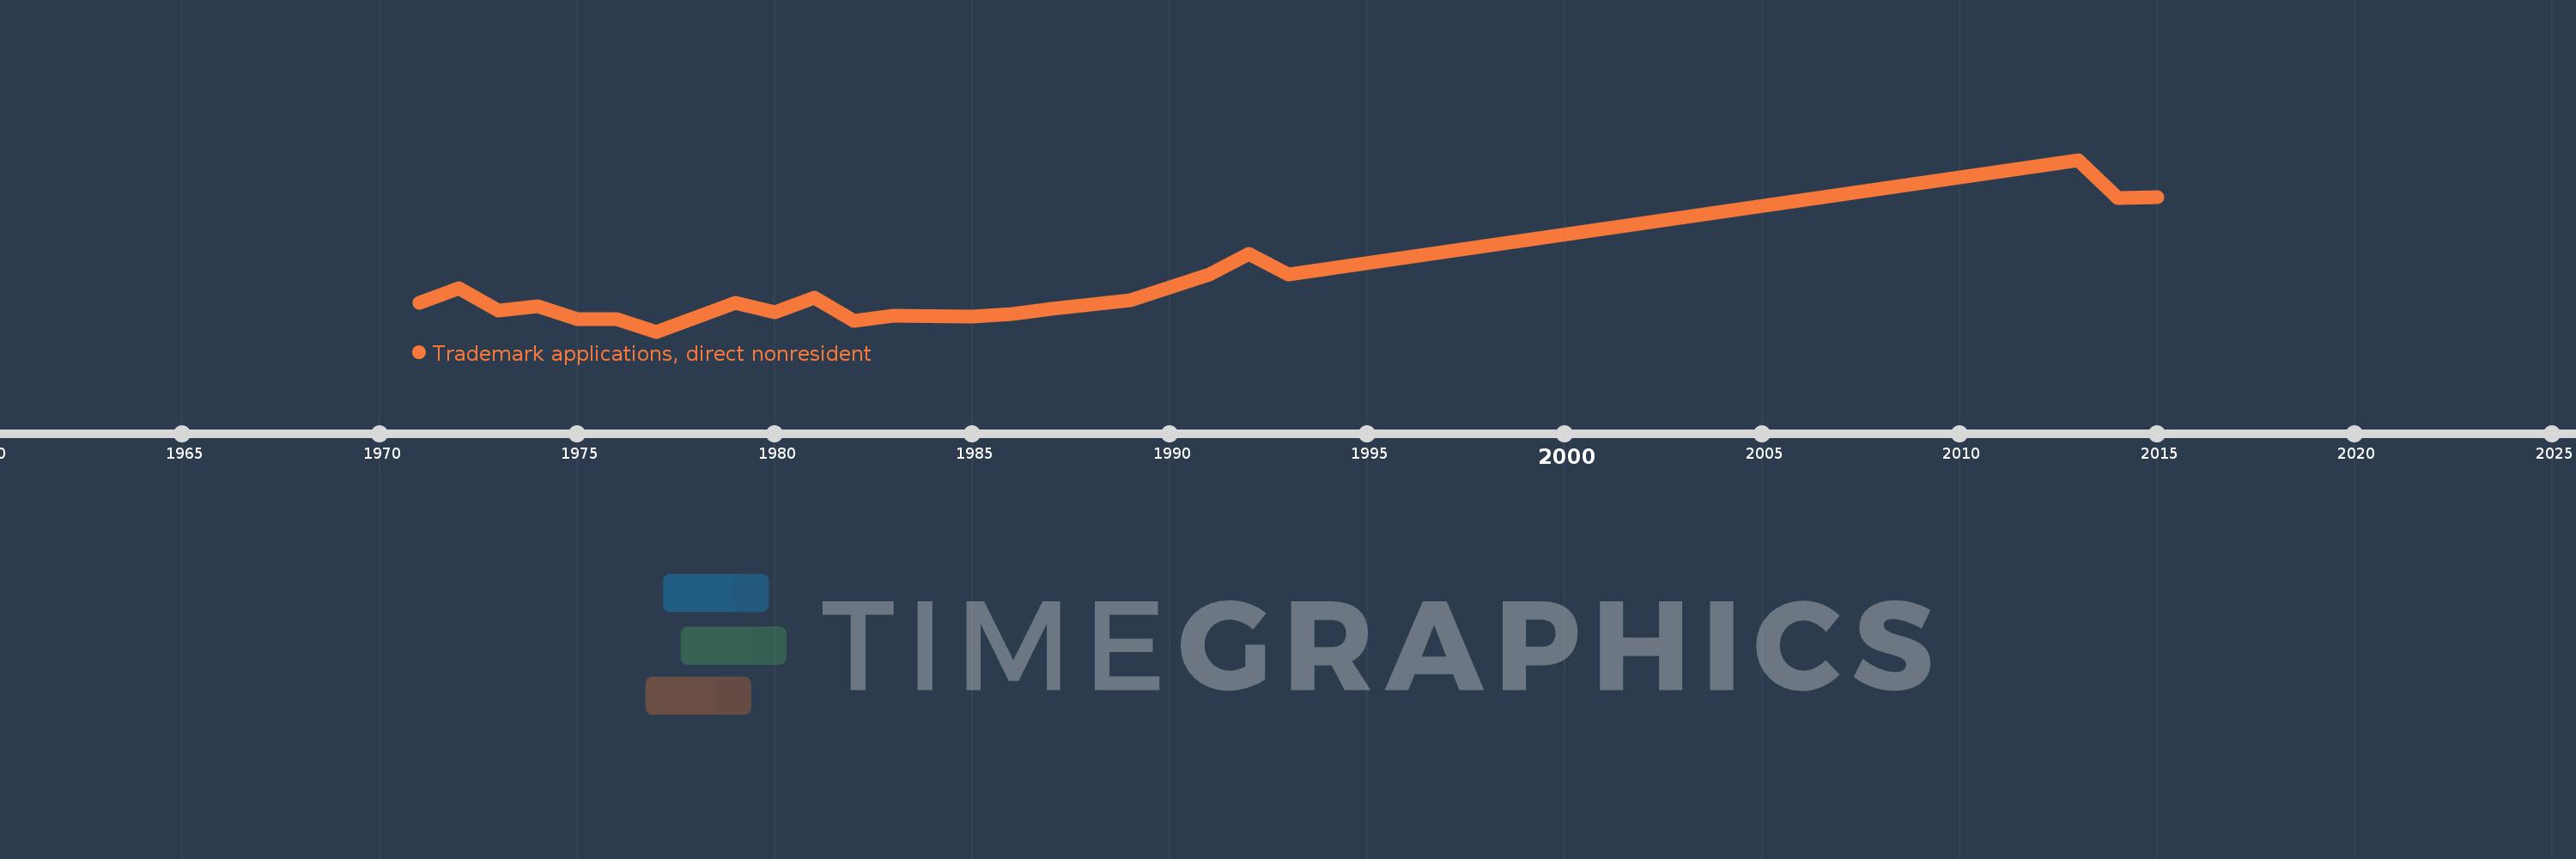
This timeline shows a graph from 1971 to 2015 of Bahamas, The. No data until 1970. Number of actual observations by date: 23.
Source name:
World Development Indicators
Source organization:
World Intellectual Property Organization (WIPO), WIPO Patent Report: Statistics on Worldwide Patent Activity. The International Bureau of WIPO assumes no responsibility with respect to the transformation of these data.
Categories, topics:
Science & Technology
Last updated:
apr 23, 2017
Indicators value changes by year
Meaning:
462.304
Minimum:
233.0
jan 1, 1977
Maximum:
1.151K
jan 1, 2013
At the date of observation
Value
Absolute change
Change from the previous value
jan 1, 1971
388.0
+388.0
0.0%
jan 1, 1972
467.0
+79.0
20.36%
jan 1, 1973
347.0
-120.0
-25.7%
jan 1, 1974
369.0
+22.0
6.34%
jan 1, 1975
300.0
-69.0
-18.7%
jan 1, 1976
300.0
0.0
0.0%
jan 1, 1977
233.0
-67.0
-22.33%
jan 1, 1978
309.0
+76.0
32.62%
jan 1, 1979
388.0
+79.0
25.57%
jan 1, 1980
335.0
-53.0
-13.66%
jan 1, 1981
415.0
+80.0
23.88%
jan 1, 1982
292.0
-123.0
-29.64%
jan 1, 1983
316.0
+24.0
8.22%
jan 1, 1985
315.0
-1.0
-0.32%
jan 1, 1986
326.0
+11.0
3.49%
jan 1, 1987
353.0
+27.0
8.28%
jan 1, 1989
399.0
+46.0
13.03%
jan 1, 1991
540.0
+141.0
35.34%
jan 1, 1992
649.0
+109.0
20.19%
jan 1, 1993
540.0
-109.0
-16.8%
jan 1, 2013
1.151K
+611.0
113.15%
jan 1, 2014
948.0
-203.0
-17.64%
jan 1, 2015
953.0
+5.0
0.53%
Ranking of countries by current statistics by years