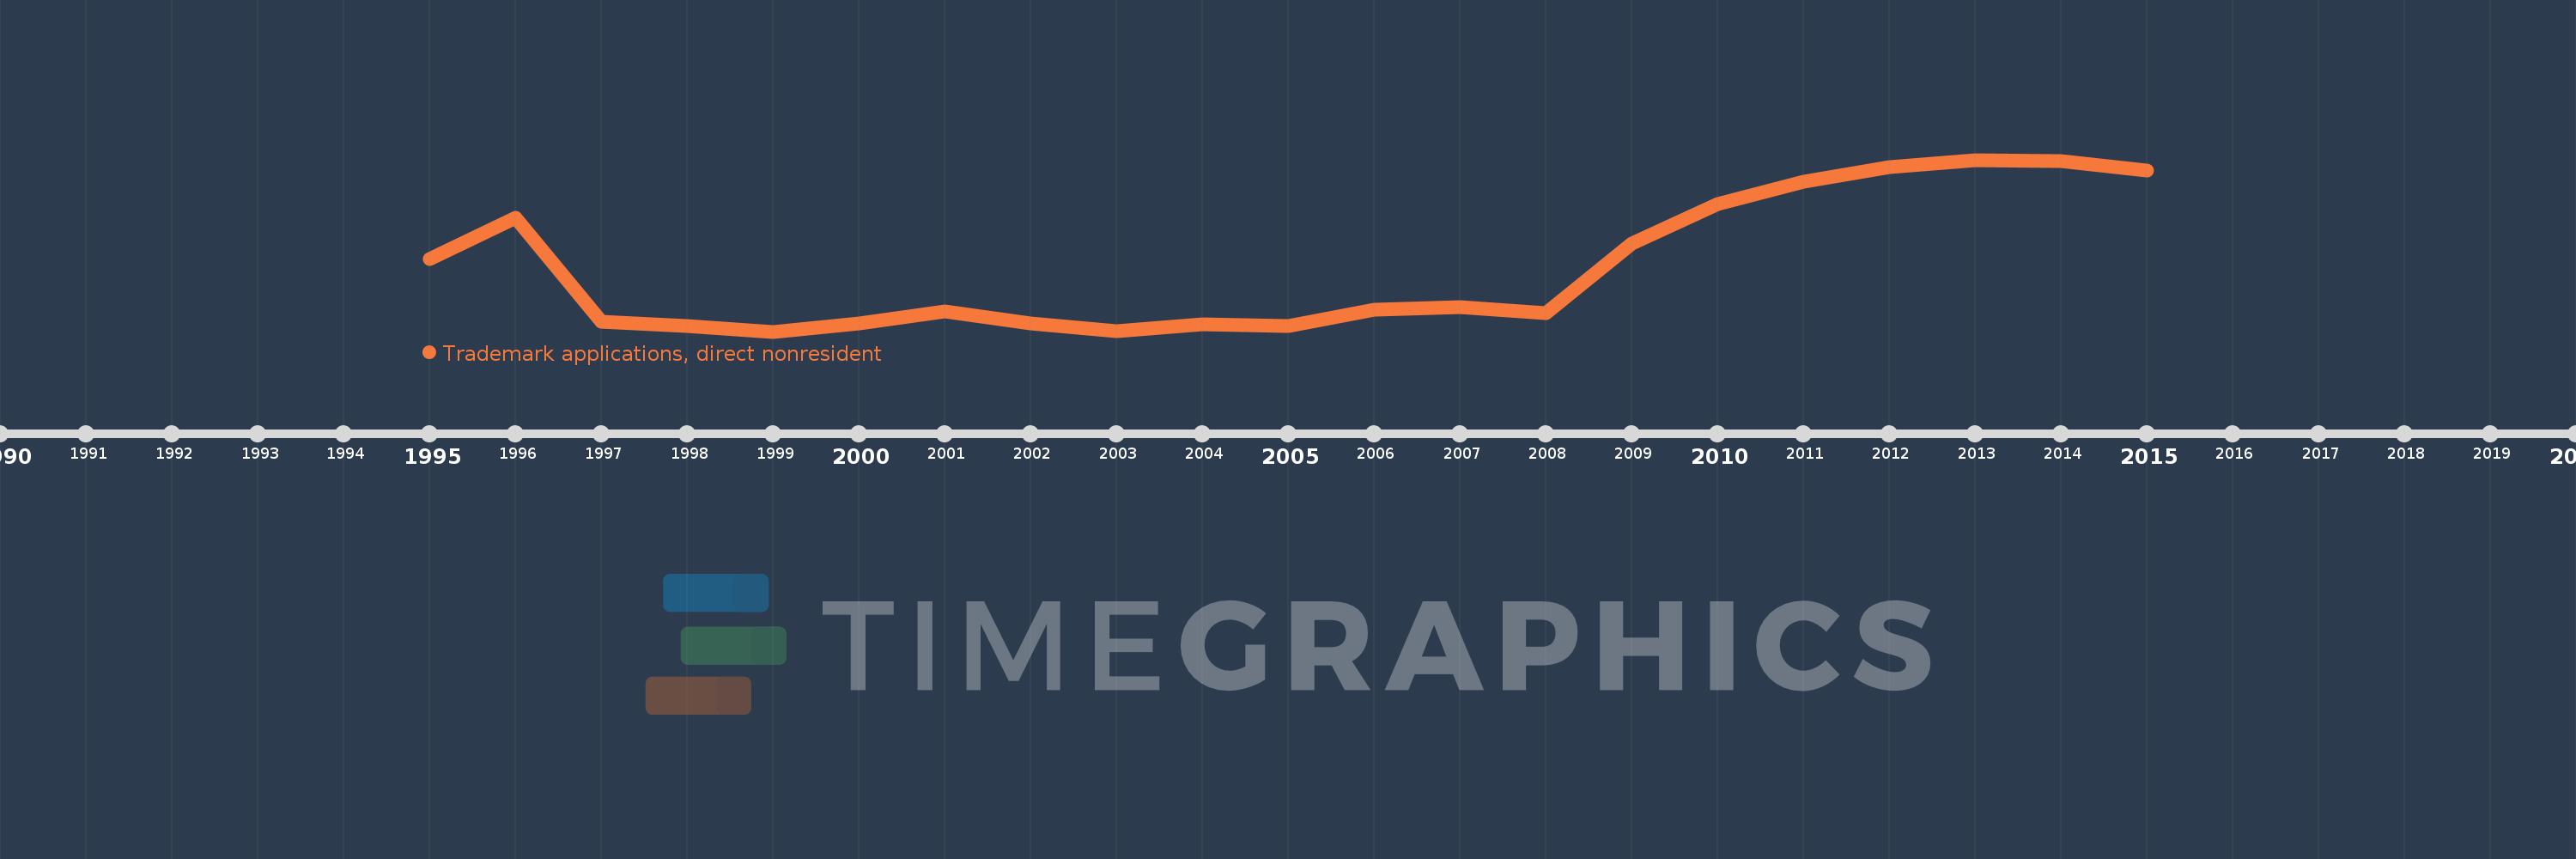
This timeline shows a graph from 1995 to 2015 of Madagascar. No data until 1994. Number of actual observations by date: 21.
Source name:
World Development Indicators
Source organization:
World Intellectual Property Organization (WIPO), WIPO Patent Report: Statistics on Worldwide Patent Activity. The International Bureau of WIPO assumes no responsibility with respect to the transformation of these data.
Categories, topics:
Science & Technology
Last updated:
apr 23, 2017
Indicators value changes by year
Meaning:
664.619
Minimum:
290.0
jan 1, 1999
Maximum:
1.291K
jan 1, 2013
At the date of observation
Value
Absolute change
Change from the previous value
jan 1, 1995
714.0
+714.0
0.0%
jan 1, 1996
954.0
+240.0
33.61%
jan 1, 1997
350.0
-604.0
-63.31%
jan 1, 1998
322.0
-28.0
-8.0%
jan 1, 1999
290.0
-32.0
-9.94%
jan 1, 2000
336.0
+46.0
15.86%
jan 1, 2001
408.0
+72.0
21.43%
jan 1, 2002
336.0
-72.0
-17.65%
jan 1, 2003
293.0
-43.0
-12.8%
jan 1, 2004
334.0
+41.0
13.99%
jan 1, 2005
321.0
-13.0
-3.89%
jan 1, 2006
419.0
+98.0
30.53%
jan 1, 2007
432.0
+13.0
3.1%
jan 1, 2008
400.0
-32.0
-7.41%
jan 1, 2009
804.0
+404.0
101.0%
jan 1, 2010
1.034K
+230.0
28.61%
jan 1, 2011
1.162K
+128.0
12.38%
jan 1, 2012
1.248K
+86.0
7.4%
jan 1, 2013
1.291K
+43.0
3.45%
jan 1, 2014
1.281K
-10.0
-0.77%
jan 1, 2015
1.228K
-53.0
-4.14%
Ranking of countries by current statistics by years