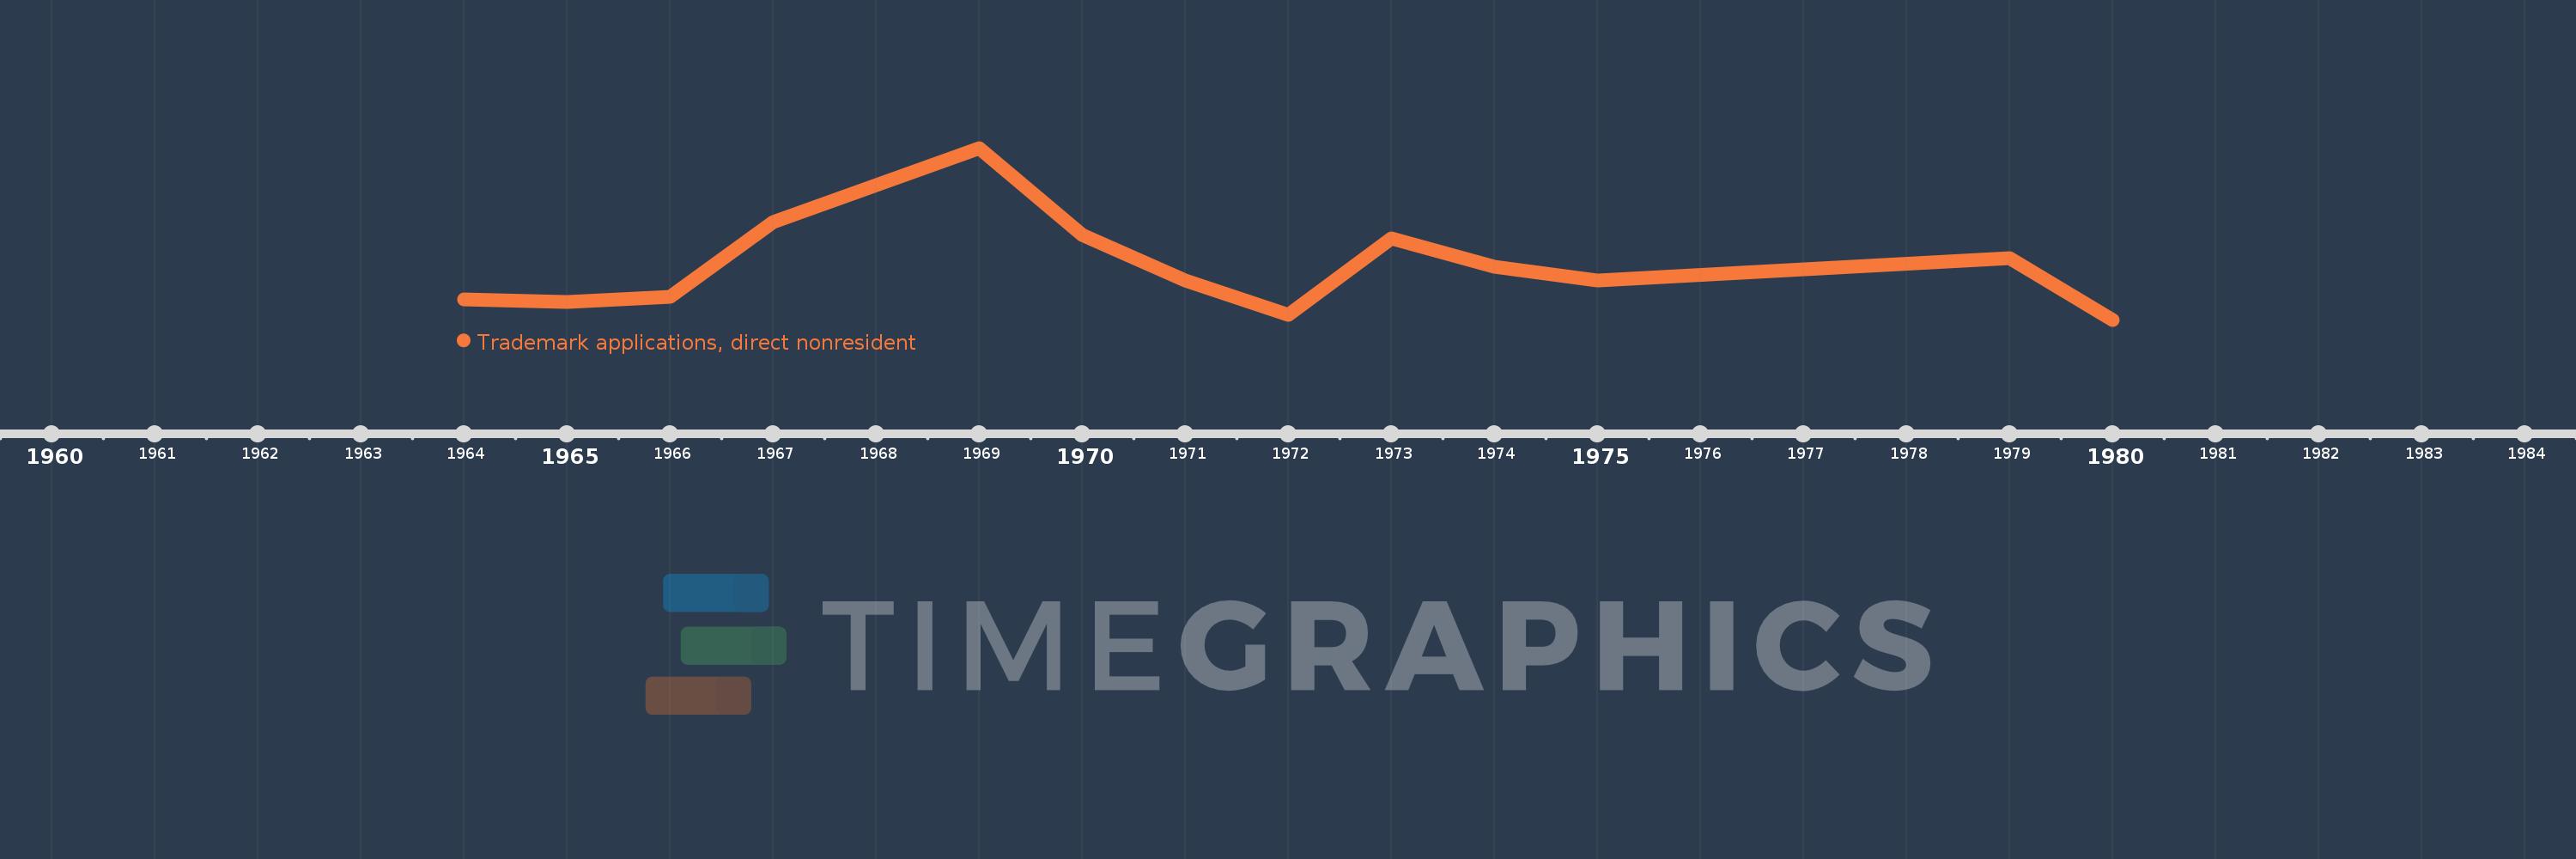
This timeline shows a graph from 1964 to 1980 of Libya. No data until 1963. Number of actual observations by date: 13.
Source name:
World Development Indicators
Source organization:
World Intellectual Property Organization (WIPO), WIPO Patent Report: Statistics on Worldwide Patent Activity. The International Bureau of WIPO assumes no responsibility with respect to the transformation of these data.
Categories, topics:
Science & Technology
Last updated:
apr 23, 2017
Indicators value changes by year
Meaning:
471.846
Minimum:
254.0
jan 1, 1980
Maximum:
956.0
jan 1, 1969
At the date of observation
Value
Absolute change
Change from the previous value
jan 1, 1964
336.0
+336.0
0.0%
jan 1, 1965
326.0
-10.0
-2.98%
jan 1, 1966
346.0
+20.0
6.13%
jan 1, 1967
653.0
+307.0
88.73%
jan 1, 1969
956.0
+303.0
46.4%
jan 1, 1970
601.0
-355.0
-37.13%
jan 1, 1971
413.0
-188.0
-31.28%
jan 1, 1972
273.0
-140.0
-33.9%
jan 1, 1973
585.0
+312.0
114.29%
jan 1, 1974
471.0
-114.0
-19.49%
jan 1, 1975
415.0
-56.0
-11.89%
jan 1, 1979
505.0
+90.0
21.69%
jan 1, 1980
254.0
-251.0
-49.7%
Ranking of countries by current statistics by years