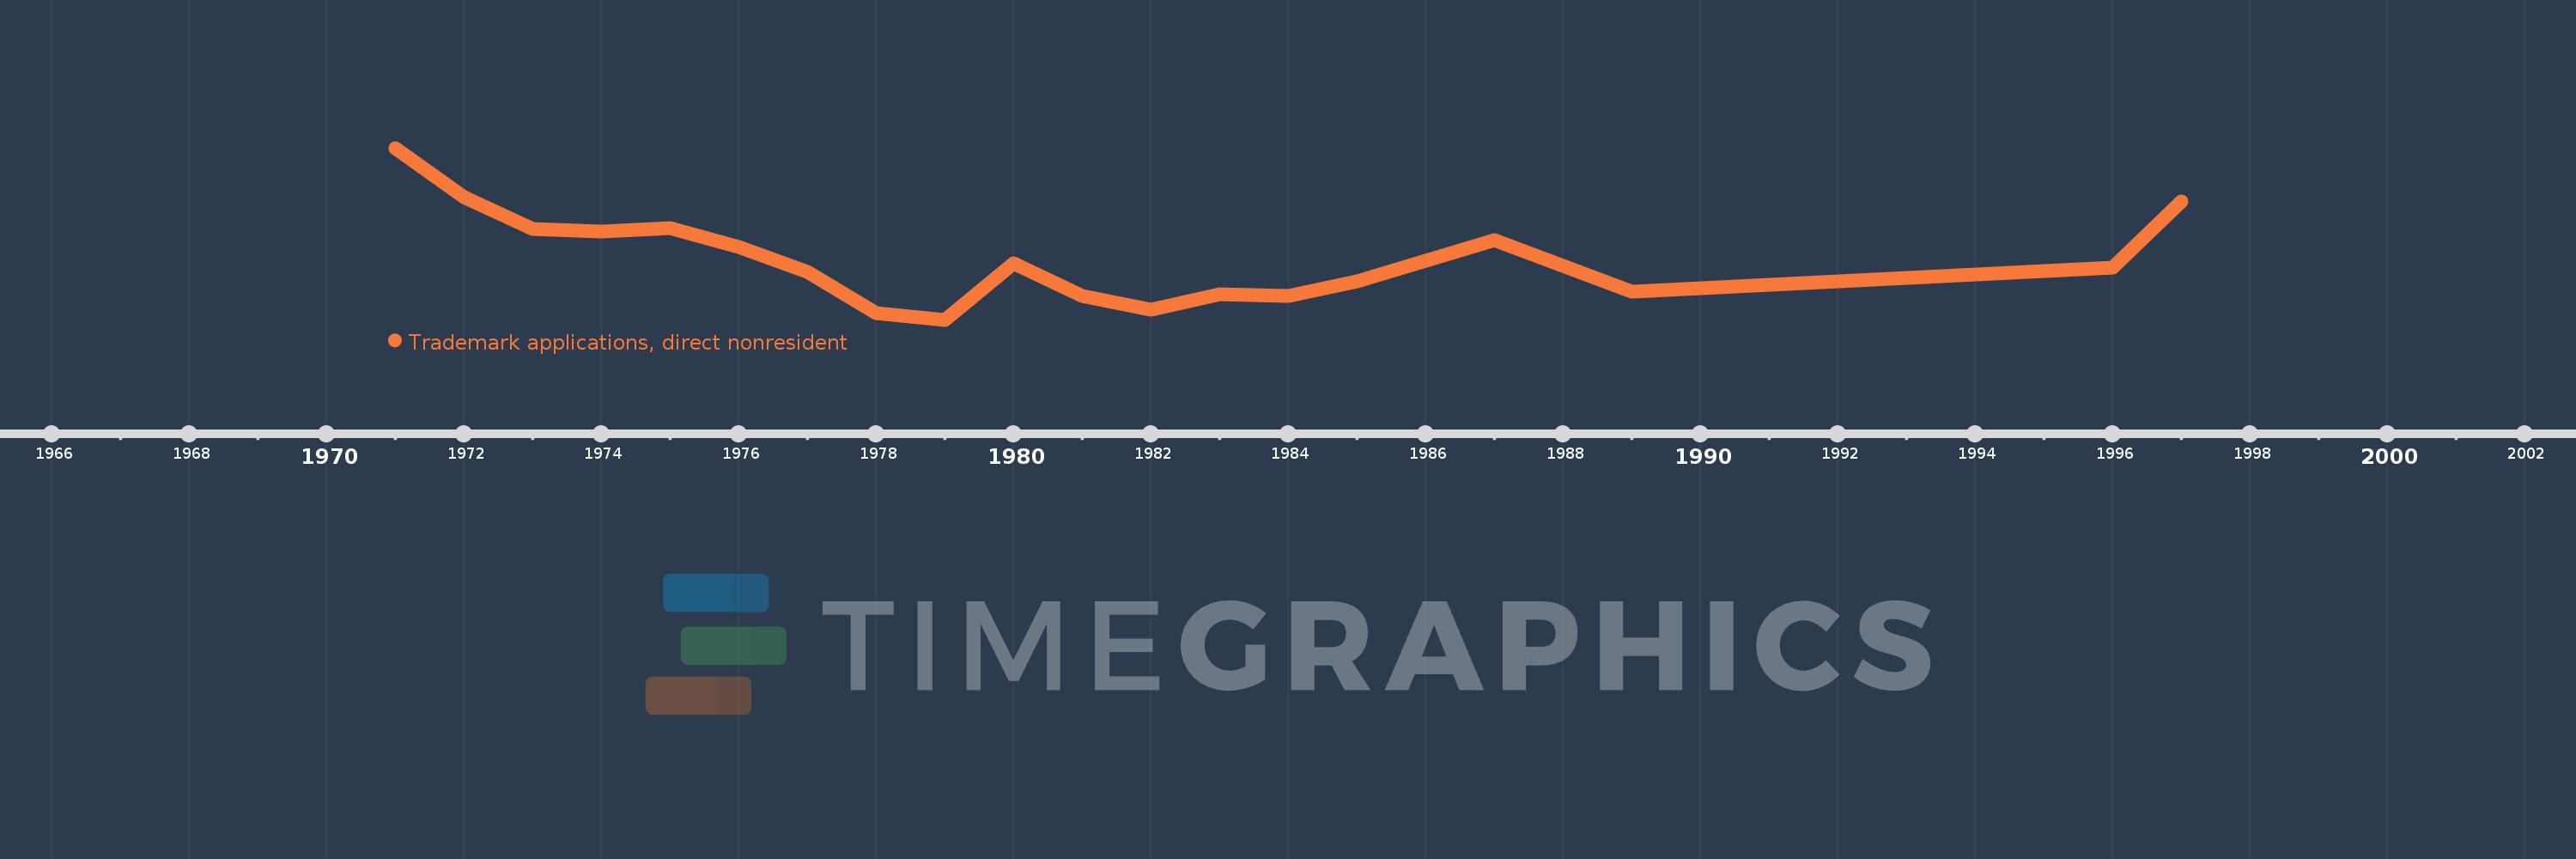
This timeline shows a graph from 1971 to 1997 of Congo, Dem. Rep.. No data until 1970. Number of actual observations by date: 19.
Source name:
World Development Indicators
Source organization:
World Intellectual Property Organization (WIPO), WIPO Patent Report: Statistics on Worldwide Patent Activity. The International Bureau of WIPO assumes no responsibility with respect to the transformation of these data.
Categories, topics:
Science & Technology
Last updated:
apr 23, 2017
Indicators value changes by year
Meaning:
302.632
Minimum:
204.0
jan 1, 1979
Maximum:
484.0
jan 1, 1971
At the date of observation
Value
Absolute change
Change from the previous value
jan 1, 1971
484.0
+484.0
0.0%
jan 1, 1972
404.0
-80.0
-16.53%
jan 1, 1973
352.0
-52.0
-12.87%
jan 1, 1974
348.0
-4.0
-1.14%
jan 1, 1975
353.0
+5.0
1.44%
jan 1, 1976
322.0
-31.0
-8.78%
jan 1, 1977
282.0
-40.0
-12.42%
jan 1, 1978
215.0
-67.0
-23.76%
jan 1, 1979
204.0
-11.0
-5.12%
jan 1, 1980
296.0
+92.0
45.1%
jan 1, 1981
243.0
-53.0
-17.91%
jan 1, 1982
221.0
-22.0
-9.05%
jan 1, 1983
246.0
+25.0
11.31%
jan 1, 1984
243.0
-3.0
-1.22%
jan 1, 1985
267.0
+24.0
9.88%
jan 1, 1987
334.0
+67.0
25.09%
jan 1, 1989
250.0
-84.0
-25.15%
jan 1, 1996
289.0
+39.0
15.6%
jan 1, 1997
397.0
+108.0
37.37%
Ranking of countries by current statistics by years