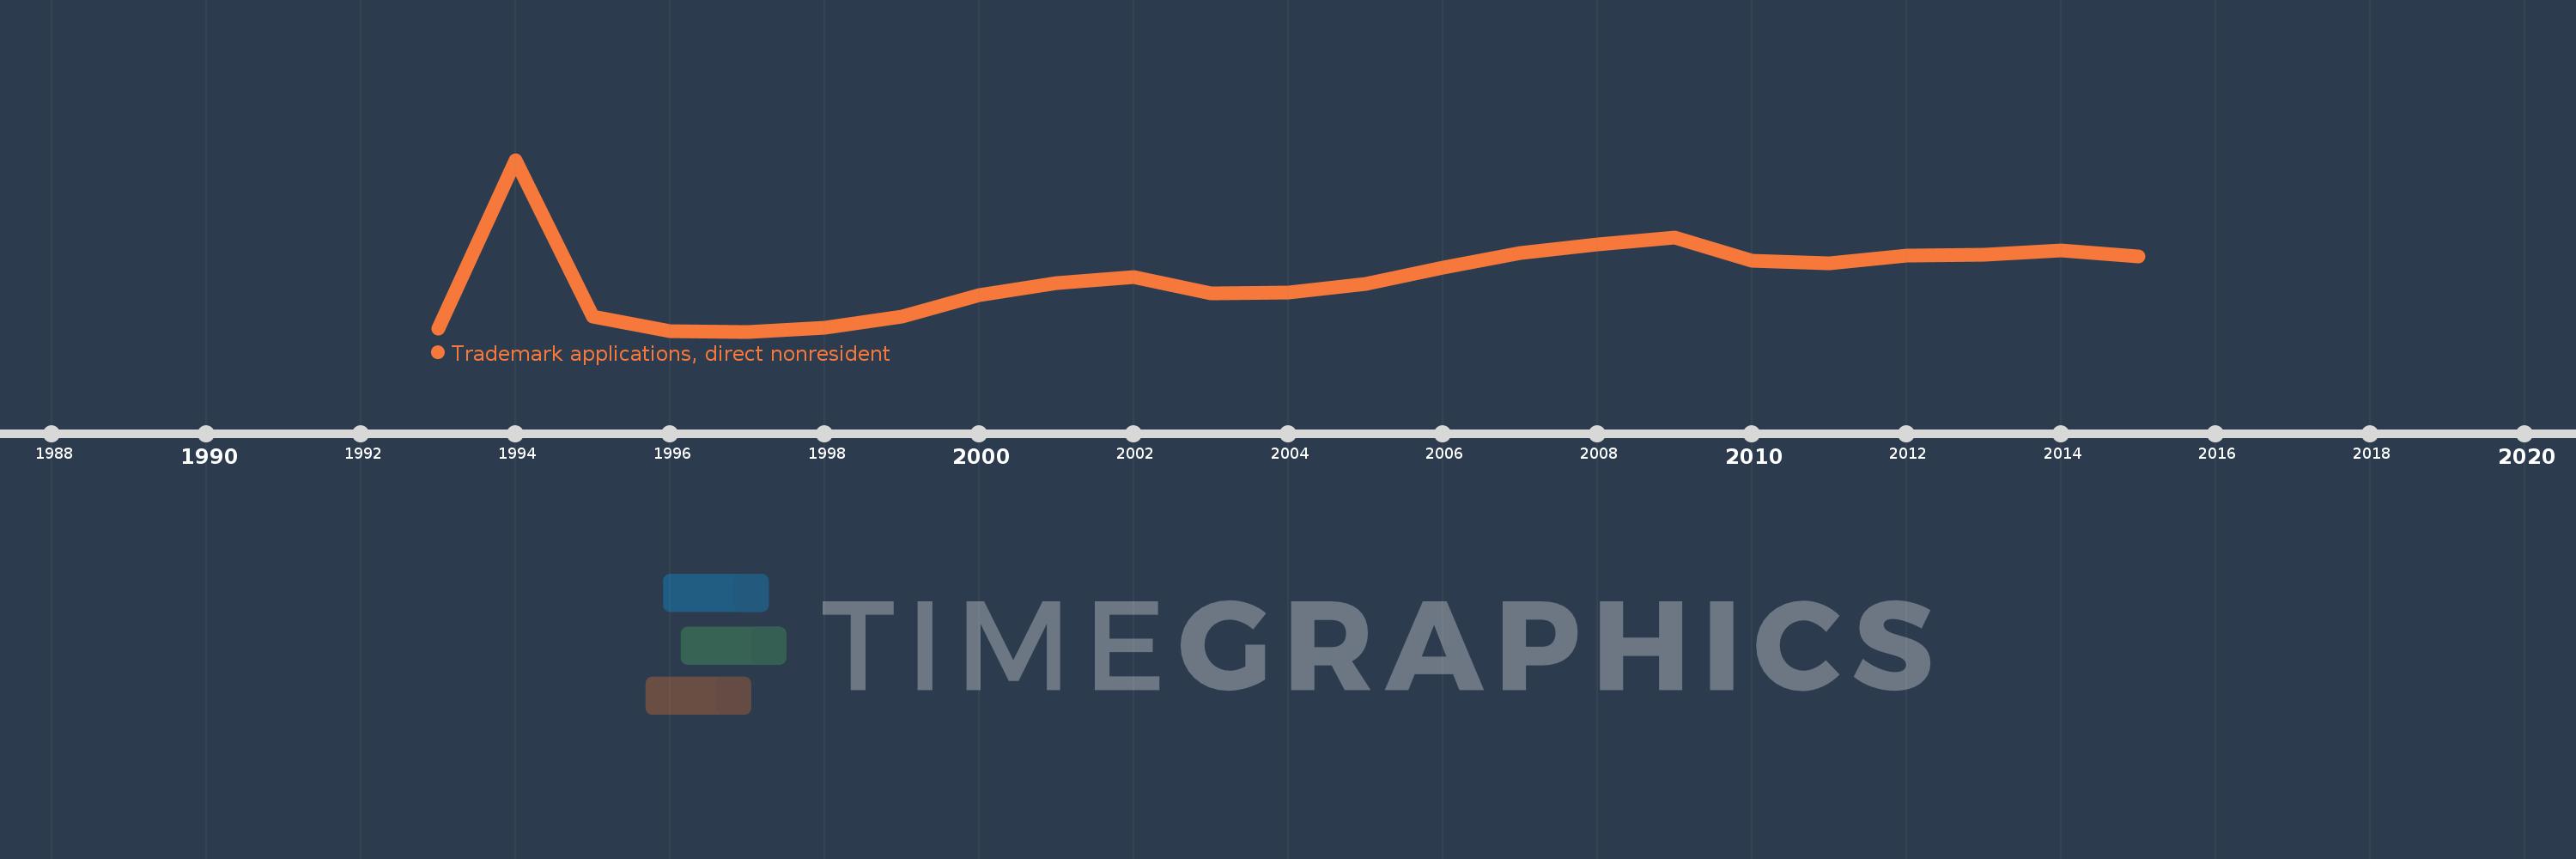
This timeline shows a graph from 1993 to 2015 of Georgia. No data until 1992. Number of actual observations by date: 23.
Source name:
World Development Indicators
Source organization:
World Intellectual Property Organization (WIPO), WIPO Patent Report: Statistics on Worldwide Patent Activity. The International Bureau of WIPO assumes no responsibility with respect to the transformation of these data.
Categories, topics:
Science & Technology
Last updated:
apr 23, 2017
Indicators value changes by year
Meaning:
3.084K
Minimum:
898.0
jan 1, 1997
Maximum:
7.824K
jan 1, 1994
At the date of observation
Value
Absolute change
Change from the previous value
jan 1, 1993
1.01K
+1.01K
0.0%
jan 1, 1994
7.824K
+6.814K
674.65%
jan 1, 1995
1.493K
-6.331K
-80.92%
jan 1, 1996
929.0
-564.0
-37.78%
jan 1, 1997
898.0
-31.0
-3.34%
jan 1, 1998
1.054K
+156.0
17.37%
jan 1, 1999
1.515K
+461.0
43.74%
jan 1, 2000
2.36K
+845.0
55.78%
jan 1, 2001
2.854K
+494.0
20.93%
jan 1, 2002
3.114K
+260.0
9.11%
jan 1, 2003
2.438K
-676.0
-21.71%
jan 1, 2004
2.481K
+43.0
1.76%
jan 1, 2005
2.834K
+353.0
14.23%
jan 1, 2006
3.479K
+645.0
22.76%
jan 1, 2007
4.065K
+586.0
16.84%
jan 1, 2008
4.412K
+347.0
8.54%
jan 1, 2009
4.682K
+270.0
6.12%
jan 1, 2010
3.761K
-921.0
-19.67%
jan 1, 2011
3.66K
-101.0
-2.69%
jan 1, 2012
3.968K
+308.0
8.42%
jan 1, 2013
4.005K
+37.0
0.93%
jan 1, 2014
4.182K
+177.0
4.42%
jan 1, 2015
3.911K
-271.0
-6.48%
Ranking of countries by current statistics by years