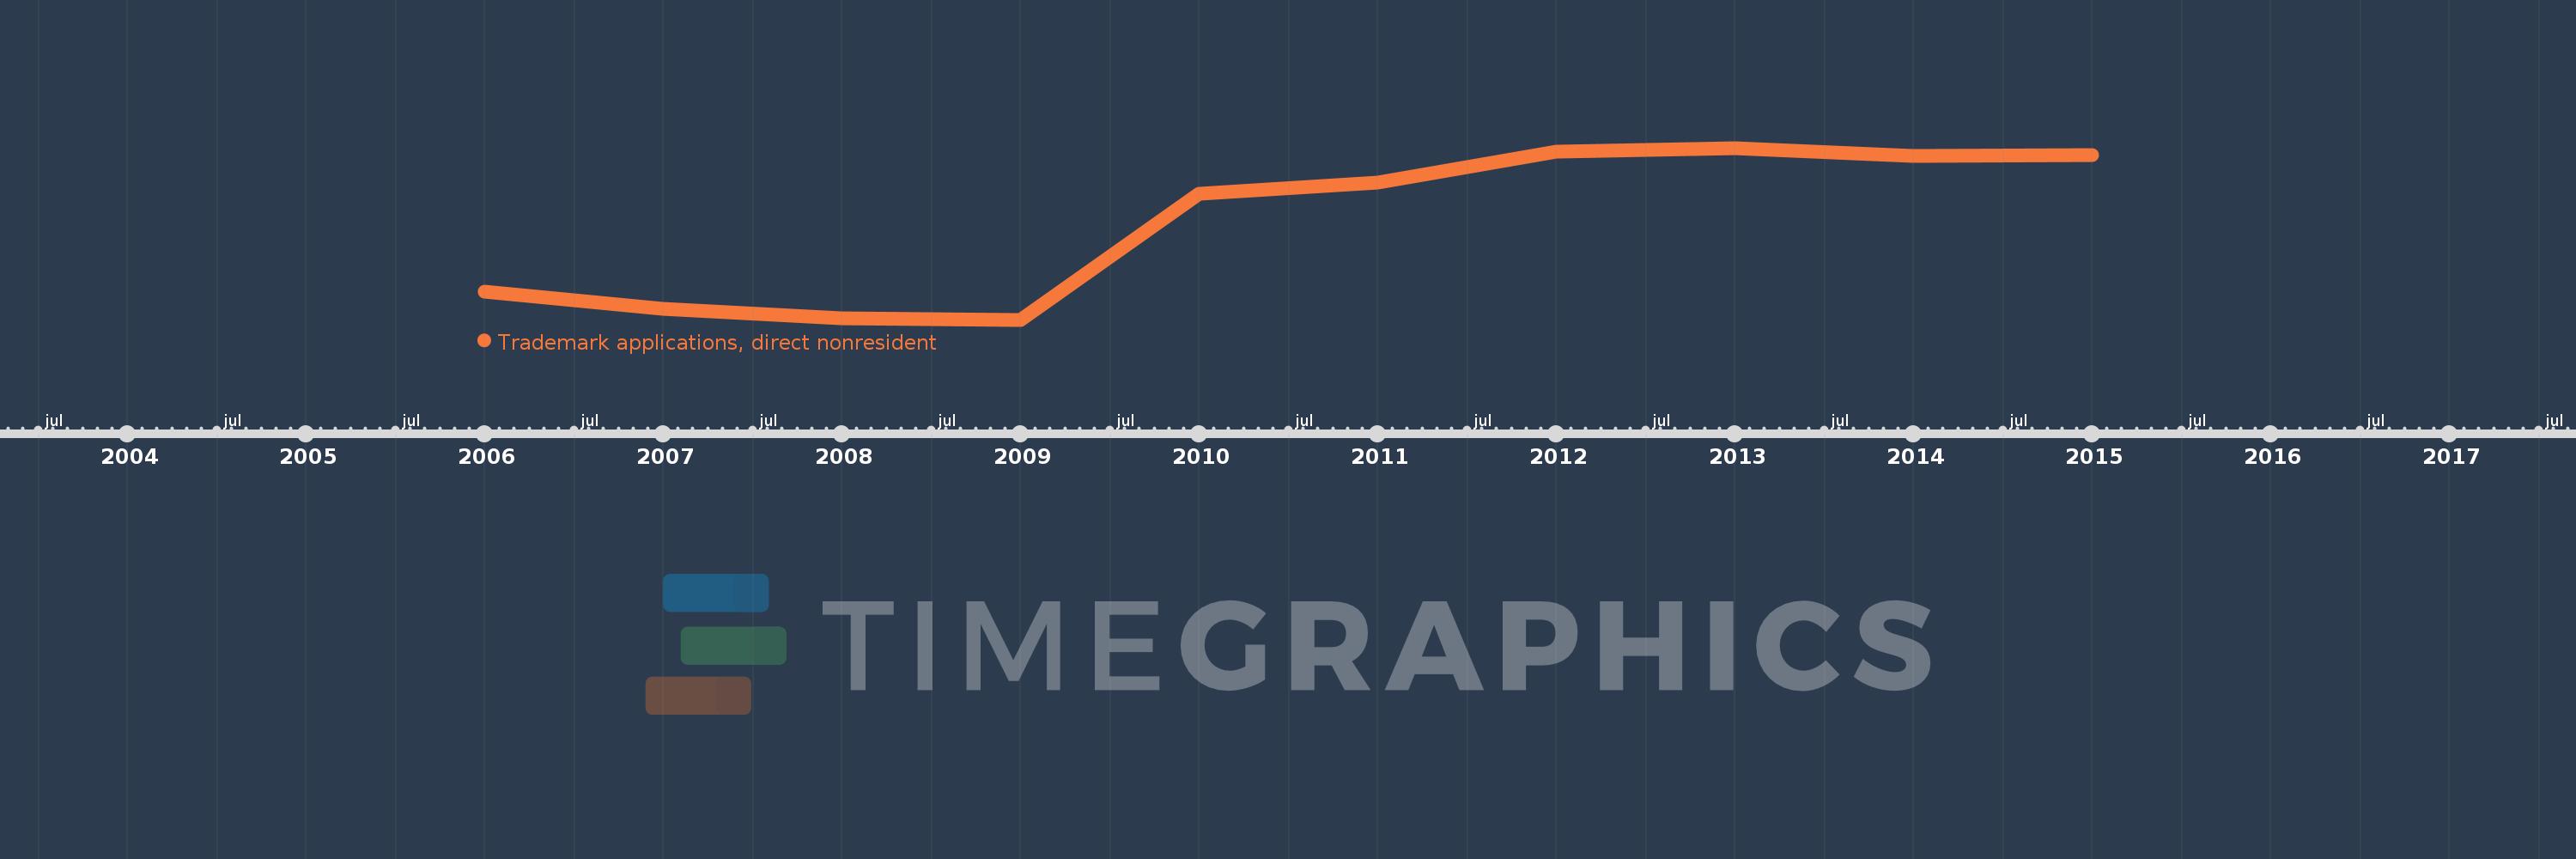
This timeline shows a graph from 2006 to 2015 of Sao Tome and Principe. No data until 2005. Number of actual observations by date: 10.
Source name:
World Development Indicators
Source organization:
World Intellectual Property Organization (WIPO), WIPO Patent Report: Statistics on Worldwide Patent Activity. The International Bureau of WIPO assumes no responsibility with respect to the transformation of these data.
Categories, topics:
Science & Technology
Last updated:
apr 23, 2017
Indicators value changes by year
Meaning:
400.5
Minimum:
123.0
jan 1, 2009
Maximum:
613.0
jan 1, 2013
At the date of observation
Value
Absolute change
Change from the previous value
jan 1, 2006
203.0
+203.0
0.0%
jan 1, 2007
155.0
-48.0
-23.65%
jan 1, 2008
128.0
-27.0
-17.42%
jan 1, 2009
123.0
-5.0
-3.91%
jan 1, 2010
483.0
+360.0
292.68%
jan 1, 2011
515.0
+32.0
6.63%
jan 1, 2012
602.0
+87.0
16.89%
jan 1, 2013
613.0
+11.0
1.83%
jan 1, 2014
590.0
-23.0
-3.75%
jan 1, 2015
593.0
+3.0
0.51%
Ranking of countries by current statistics by years