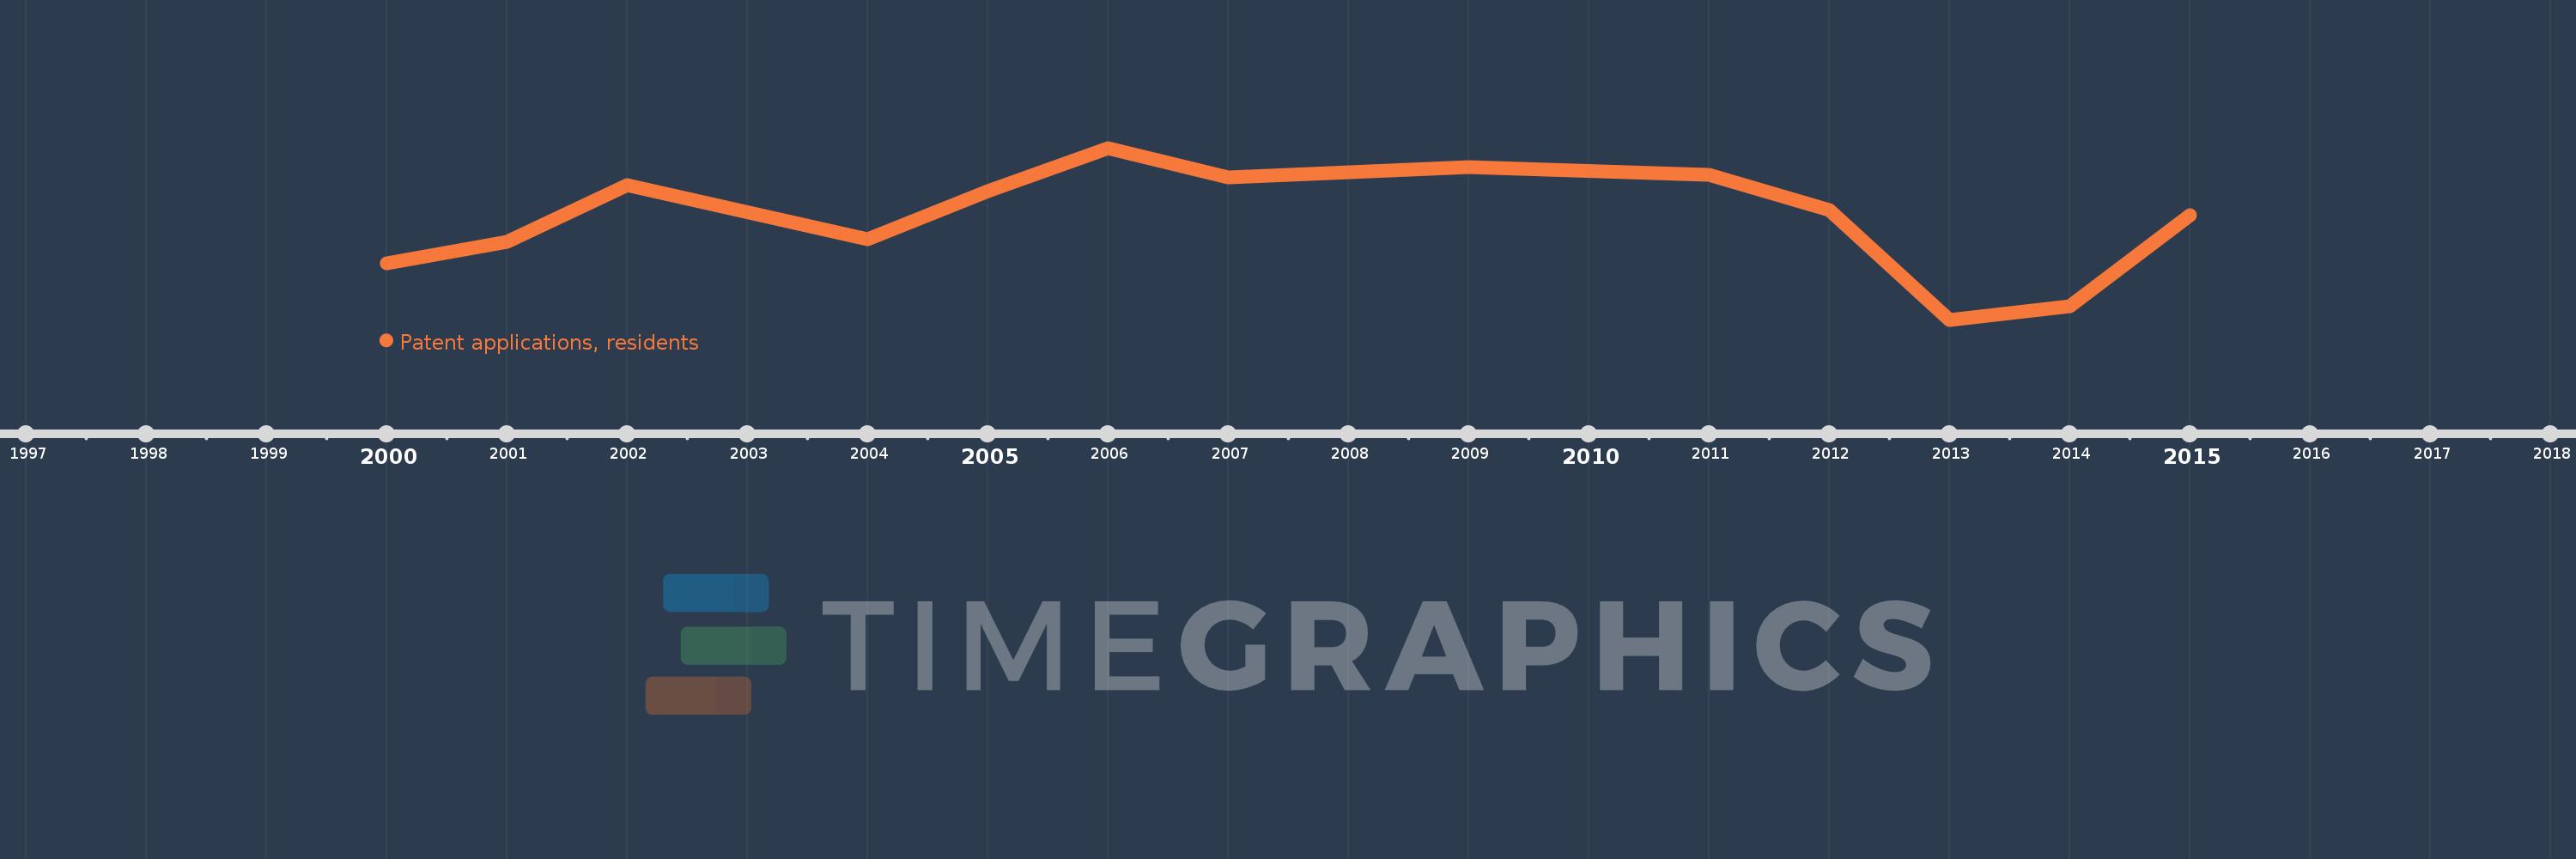
This timeline shows a graph from 2000 to 2015 of Bosnia and Herzegovina. No data until 1999. Number of actual observations by date: 13.
Source name:
World Development Indicators
Source organization:
World Intellectual Property Organization (WIPO), WIPO Patent Report: Statistics on Worldwide Patent Activity. The International Bureau of WIPO assumes no responsibility with respect to the transformation of these data.
Categories, topics:
Science & Technology
Last updated:
apr 23, 2017
Indicators value changes by year
Meaning:
39.769
Minimum:
2.0
jan 1, 2013
Maximum:
66.0
jan 1, 2006
At the date of observation
Value
Absolute change
Change from the previous value
jan 1, 2000
23.0
+23.0
0.0%
jan 1, 2001
31.0
+8.0
34.78%
jan 1, 2002
52.0
+21.0
67.74%
jan 1, 2004
32.0
-20.0
-38.46%
jan 1, 2005
50.0
+18.0
56.25%
jan 1, 2006
66.0
+16.0
32.0%
jan 1, 2007
55.0
-11.0
-16.67%
jan 1, 2009
59.0
+4.0
7.27%
jan 1, 2011
56.0
-3.0
-5.08%
jan 1, 2012
43.0
-13.0
-23.21%
jan 1, 2013
2.0
-41.0
-95.35%
jan 1, 2014
7.0
+5.0
250.0%
jan 1, 2015
41.0
+34.0
485.71%
Ranking of countries by current statistics by years