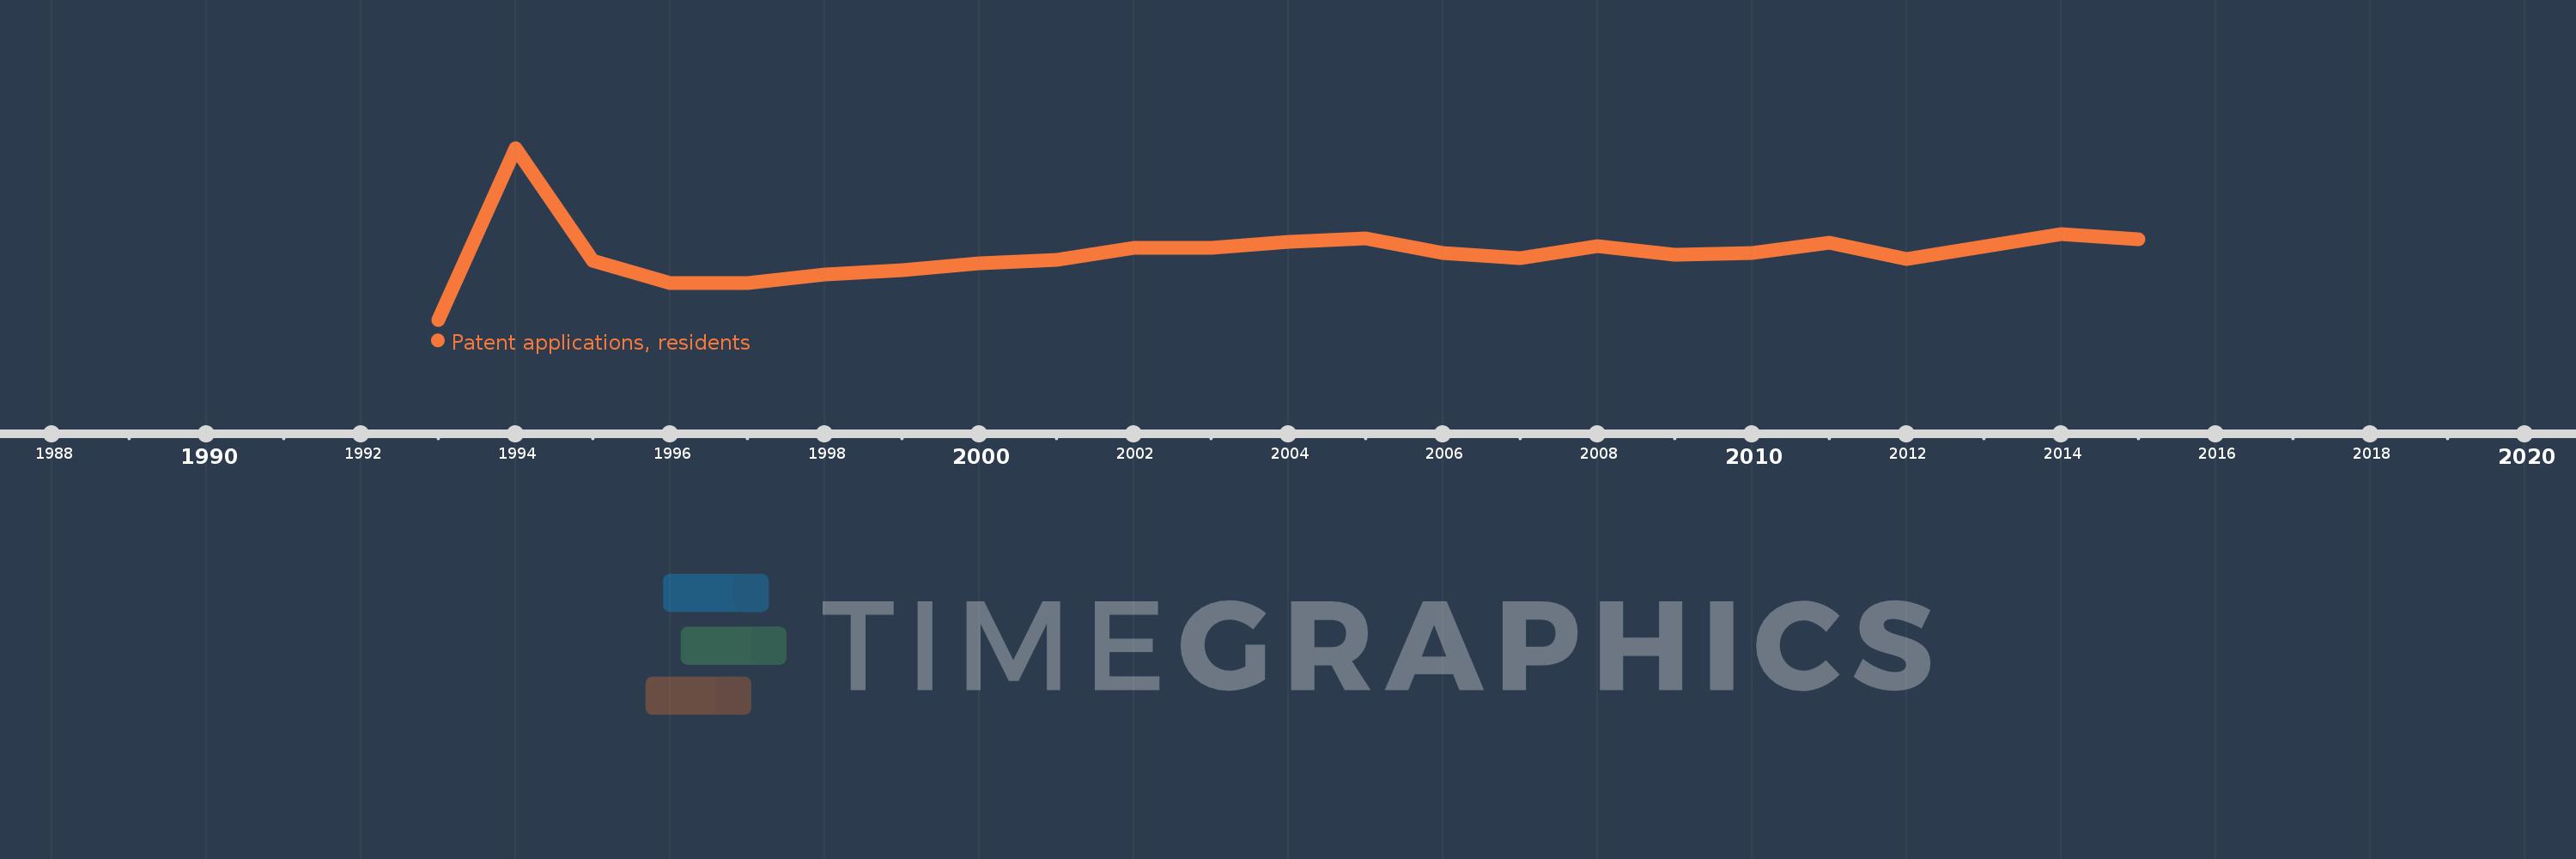
This timeline shows a graph from 1993 to 2015 of Kazakhstan. No data until 1992. Number of actual observations by date: 22.
Source name:
World Development Indicators
Source organization:
World Intellectual Property Organization (WIPO), WIPO Patent Report: Statistics on Worldwide Patent Activity. The International Bureau of WIPO assumes no responsibility with respect to the transformation of these data.
Categories, topics:
Science & Technology
Last updated:
apr 23, 2017
Indicators value changes by year
Meaning:
1.508K
Minimum:
433.0
jan 1, 1993
Maximum:
3.223K
jan 1, 1994
At the date of observation
Value
Absolute change
Change from the previous value
jan 1, 1993
433.0
+433.0
0.0%
jan 1, 1994
3.223K
+2.79K
644.34%
jan 1, 1995
1.393K
-1.83K
-56.78%
jan 1, 1996
1.031K
-362.0
-25.99%
jan 1, 1997
1.022K
-9.0
-0.87%
jan 1, 1998
1.171K
+149.0
14.58%
jan 1, 1999
1.244K
+73.0
6.23%
jan 1, 2000
1.352K
+108.0
8.68%
jan 1, 2001
1.399K
+47.0
3.48%
jan 1, 2002
1.607K
+208.0
14.87%
jan 1, 2003
1.594K
-13.0
-0.81%
jan 1, 2004
1.696K
+102.0
6.4%
jan 1, 2005
1.756K
+60.0
3.54%
jan 1, 2006
1.523K
-233.0
-13.27%
jan 1, 2007
1.433K
-90.0
-5.91%
jan 1, 2008
1.633K
+200.0
13.96%
jan 1, 2009
1.483K
-150.0
-9.19%
jan 1, 2010
1.513K
+30.0
2.02%
jan 1, 2011
1.691K
+178.0
11.76%
jan 1, 2012
1.415K
-276.0
-16.32%
jan 1, 2014
1.824K
+409.0
28.9%
jan 1, 2015
1.742K
-82.0
-4.5%
Ranking of countries by current statistics by years