29
/
en
AIzaSyAYiBZKx7MnpbEhh9jyipgxe19OcubqV5w
April 1, 2024
115223
Croatia
HRV
true
2
1
Patent applications, residents
2015,2014,2013,2012,2011,2010,2009,2008,2007,2006,2005,2004,2003,2002,2001,2000,1999,1998,1997,1996,1995,1994,1993
Download
Global statistics library →Croatia →

Patent applications, residents

This statistics in other country:
AlbaniaAlgeriaAngolaArab WorldArgentinaArmeniaArubaAustraliaAustriaAzerbaijanBahamas, TheBahrainBangladeshBarbadosBelarusBelgiumBelizeBhutanBoliviaBosnia and HerzegovinaBotswanaBrazilBrunei DarussalamBulgariaBurkina FasoBurundiCambodiaCanadaCaribbean small statesCentral Europe and the BalticsChileChinaColombiaCongo, Dem. Rep.Congo, Rep.Costa RicaCote d'IvoireCroatiaCubaCyprusCzech RepublicDenmarkDjiboutiDominican RepublicEarly-demographic dividendEast Asia & PacificEast Asia & Pacific (excluding high income)East Asia & Pacific (IDA & IBRD countries)EcuadorEgypt, Arab Rep.El SalvadorEstoniaEthiopiaEuro areaEurope & Central AsiaEurope & Central Asia (excluding high income)Europe & Central Asia (IDA & IBRD countries)European UnionFijiFinlandFranceGeorgiaGermanyGreeceGuatemalaGuyanaHaitiHigh incomeHondurasHong Kong SAR, ChinaHungaryIBRD onlyIcelandIDA & IBRD totalIDA blendIndiaIndonesiaIran, Islamic Rep.IraqIrelandIsraelItalyJamaicaJapanJordanKazakhstanKenyaKiribatiKorea, Dem. People’s Rep.Korea, Rep.KuwaitKyrgyz RepublicLao PDRLate-demographic dividendLatin America & Caribbean Latin America & Caribbean (excluding high income)Latin America & the Caribbean (IDA & IBRD countries)LatviaLebanonLesothoLiberiaLibyaLithuaniaLow & middle incomeLower middle incomeLuxembourgMacao SAR, ChinaMacedonia, FYRMadagascarMalawiMalaysiaMaliMaltaMauritiusMexicoMiddle East & North AfricaMiddle East & North Africa (excluding high income)Middle East & North Africa (IDA & IBRD countries)Middle incomeMoldovaMonacoMongoliaMontenegroMoroccoMozambiqueNamibiaNepalNetherlandsNew ZealandNicaraguaNigeriaNorth AmericaNorwayOECD membersPakistanPanamaPapua New GuineaParaguayPeruPhilippinesPolandPortugalPost-demographic dividendQatarRomaniaRussian FederationRwandaSamoaSaudi ArabiaSerbiaSierra LeoneSingaporeSlovak RepublicSloveniaSomaliaSouth AfricaSouth AsiaSouth Asia (IDA & IBRD)SpainSri LankaSudanSwazilandSwedenSwitzerlandSyrian Arab RepublicTajikistanTanzaniaThailandTrinidad and TobagoTunisiaTurkeyTurkmenistanUgandaUkraineUnited Arab EmiratesUnited KingdomUnited StatesUpper middle incomeUruguayUzbekistanVenezuela, RBVietnamWorldYemen, Rep.ZambiaZimbabwe
Timeline:
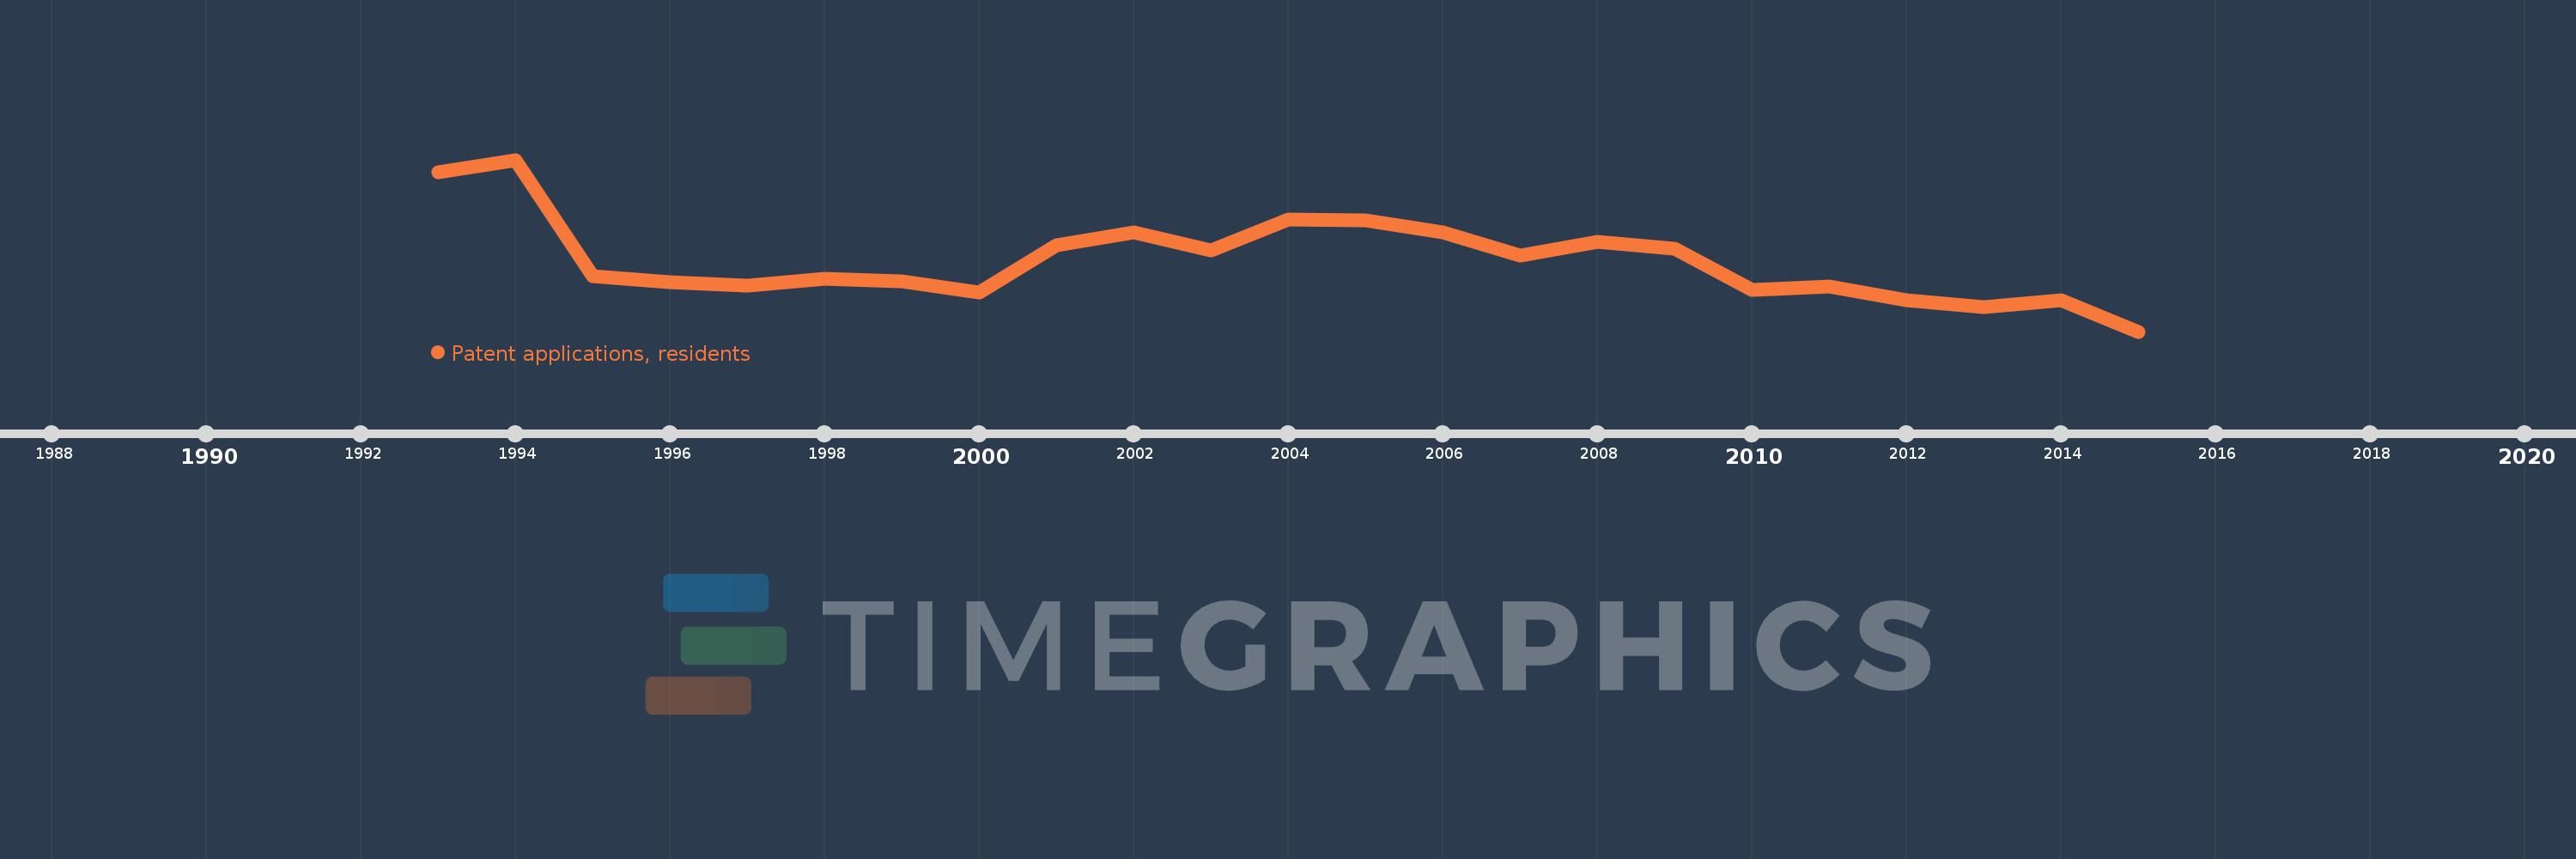
This timeline shows a graph from 1993 to 2015 of Croatia. No data until 1992. Number of actual observations by date: 23.
Source name:
World Development Indicators
Source organization:
World Intellectual Property Organization (WIPO), WIPO Patent Report: Statistics on Worldwide Patent Activity. The International Bureau of WIPO assumes no responsibility with respect to the transformation of these data.
Categories, topics:
Science & Technology
Last updated:
apr 23, 2017
Indicators value changes by year
Mean:
307.652
Minimum:
170.0
jan 1, 2015
Maximum:
503.0
jan 1, 1994
At the date of observation
Value
Absolute change
Change from previous value
jan 1, 1993
479.0
+479.0
0.0%
jan 1, 1994
503.0
+24.0
5.01%
jan 1, 1995
277.0
-226.0
-44.93%
jan 1, 1996
265.0
-12.0
-4.33%
jan 1, 1997
259.0
-6.0
-2.26%
jan 1, 1998
273.0
+14.0
5.41%
jan 1, 1999
267.0
-6.0
-2.2%
jan 1, 2000
246.0
-21.0
-7.87%
jan 1, 2001
337.0
+91.0
36.99%
jan 1, 2002
362.0
+25.0
7.42%
jan 1, 2003
328.0
-34.0
-9.39%
jan 1, 2004
387.0
+59.0
17.99%
jan 1, 2005
385.0
-2.0
-0.52%
jan 1, 2006
363.0
-22.0
-5.71%
jan 1, 2007
317.0
-46.0
-12.67%
jan 1, 2008
344.0
+27.0
8.52%
jan 1, 2009
330.0
-14.0
-4.07%
jan 1, 2010
250.0
-80.0
-24.24%
jan 1, 2011
257.0
+7.0
2.8%
jan 1, 2012
230.0
-27.0
-10.51%
jan 1, 2013
217.0
-13.0
-5.65%
jan 1, 2014
230.0
+13.0
5.99%
jan 1, 2015
170.0
-60.0
-26.09%
Ranking of countries by current statistics by years

Comments:

Send
PremiumAbout & FeedbackTermsPrivacy
logo
© 2022 Selected Technologies LLC – Morgan Hill, California