33
/
AIzaSyAYiBZKx7MnpbEhh9jyipgxe19OcubqV5w
August 1, 2025
138491
Georgia
GEO
true
2
1
Patent applications, residents
2015,2014,2013,2012,2011,2010,2009,2008,2007,2006,2005,2004,2003,2002,2001,2000,1999,1998,1997,1996,1995,1994,1993
Download
Global statistics library →Georgia →

Patent applications, residents

This statistics in other country:

AlbaniaAlgeriaAngolaArab WorldArgentinaArmeniaArubaAustraliaAustriaAzerbaijanBahamas, TheBahrainBangladeshBarbadosBelarusBelgiumBelizeBhutanBoliviaBosnia and HerzegovinaBotswanaBrazilBrunei DarussalamBulgariaBurkina FasoBurundiCambodiaCanadaCaribbean small statesCentral Europe and the BalticsChileChinaColombiaCongo, Dem. Rep.Congo, Rep.Costa RicaCote d'IvoireCroatiaCubaCyprusCzech RepublicDenmarkDjiboutiDominican RepublicEarly-demographic dividendEast Asia & PacificEast Asia & Pacific (excluding high income)East Asia & Pacific (IDA & IBRD countries)EcuadorEgypt, Arab Rep.El SalvadorEstoniaEthiopiaEuro areaEurope & Central AsiaEurope & Central Asia (excluding high income)Europe & Central Asia (IDA & IBRD countries)European UnionFijiFinlandFranceGeorgiaGermanyGreeceGuatemalaGuyanaHaitiHigh incomeHondurasHong Kong SAR, ChinaHungaryIBRD onlyIcelandIDA & IBRD totalIDA blendIndiaIndonesiaIran, Islamic Rep.IraqIrelandIsraelItalyJamaicaJapanJordanKazakhstanKenyaKiribatiKorea, Dem. People’s Rep.Korea, Rep.KuwaitKyrgyz RepublicLao PDRLate-demographic dividendLatin America & Caribbean Latin America & Caribbean (excluding high income)Latin America & the Caribbean (IDA & IBRD countries)LatviaLebanonLesothoLiberiaLibyaLithuaniaLow & middle incomeLower middle incomeLuxembourgMacao SAR, ChinaMacedonia, FYRMadagascarMalawiMalaysiaMaliMaltaMauritiusMexicoMiddle East & North AfricaMiddle East & North Africa (excluding high income)Middle East & North Africa (IDA & IBRD countries)Middle incomeMoldovaMonacoMongoliaMontenegroMoroccoMozambiqueNamibiaNepalNetherlandsNew ZealandNicaraguaNigeriaNorth AmericaNorwayOECD membersPakistanPanamaPapua New GuineaParaguayPeruPhilippinesPolandPortugalPost-demographic dividendQatarRomaniaRussian FederationRwandaSamoaSaudi ArabiaSerbiaSierra LeoneSingaporeSlovak RepublicSloveniaSomaliaSouth AfricaSouth AsiaSouth Asia (IDA & IBRD)SpainSri LankaSudanSwazilandSwedenSwitzerlandSyrian Arab RepublicTajikistanTanzaniaThailandTrinidad and TobagoTunisiaTurkeyTurkmenistanUgandaUkraineUnited Arab EmiratesUnited KingdomUnited StatesUpper middle incomeUruguayUzbekistanVenezuela, RBVietnamWorldYemen, Rep.ZambiaZimbabwe

Timeline:

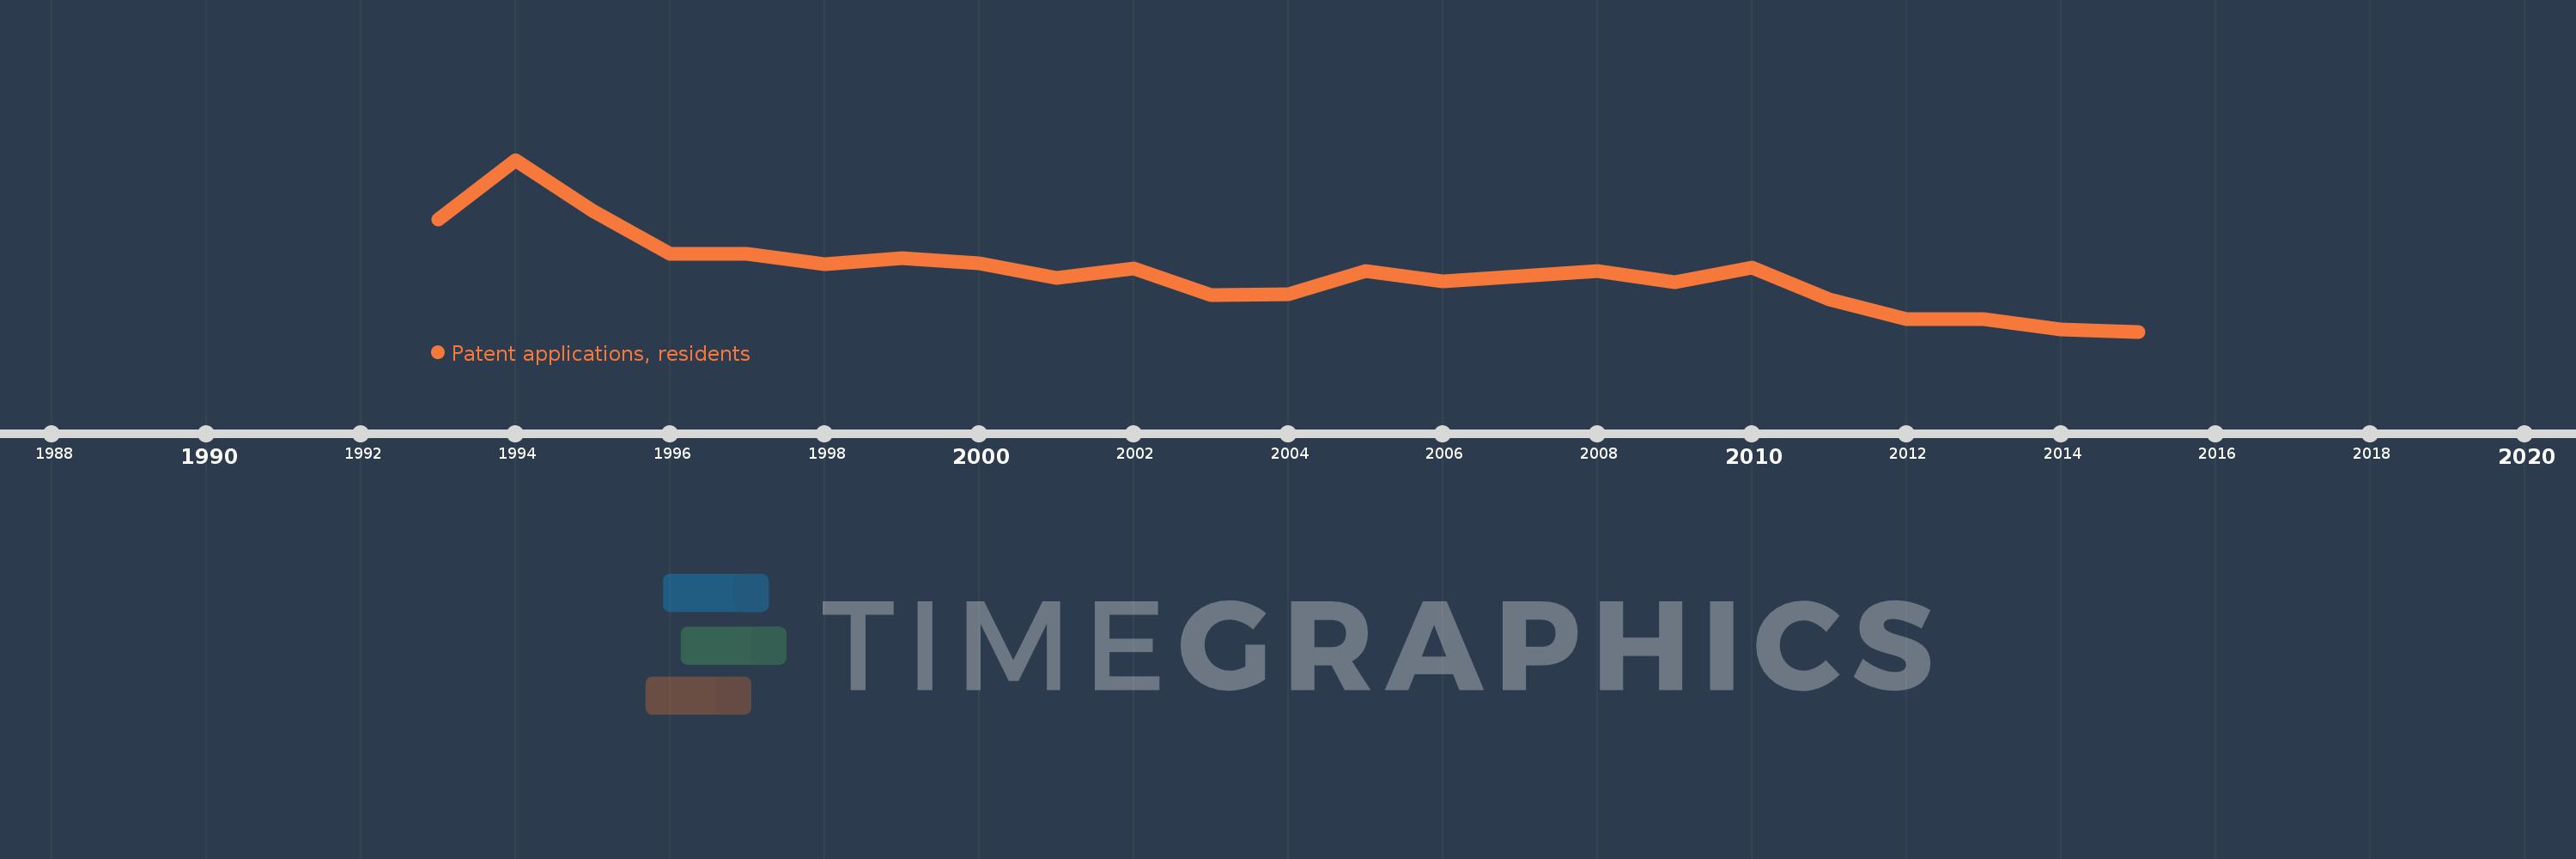
This timeline shows a graph from 1993 to 2015 of Georgia. No data until 1992. Number of actual observations by date: 23.

Source name:

World Development Indicators

Source organization:

World Intellectual Property Organization (WIPO), WIPO Patent Report: Statistics on Worldwide Patent Activity. The International Bureau of WIPO assumes no responsibility with respect to the transformation of these data.

Categories, topics:

Science & Technology

Last updated:

apr 23, 2017

Indicators value changes by year

Meaning:
244.696
Minimum:
110.0
jan 1, 2015
Maximum:
502.0
jan 1, 1994
At the date of observation
Value
Absolute change
Change from the previous value
jan 1, 1993
365.0
+365.0
0.0%
jan 1, 1994
502.0
+137.0
37.53%
jan 1, 1995
386.0
-116.0
-23.11%
jan 1, 1996
287.0
-99.0
-25.65%
jan 1, 1997
288.0
+1.0
0.35%
jan 1, 1998
263.0
-25.0
-8.68%
jan 1, 1999
277.0
+14.0
5.32%
jan 1, 2000
265.0
-12.0
-4.33%
jan 1, 2001
232.0
-33.0
-12.45%
jan 1, 2002
254.0
+22.0
9.48%
jan 1, 2003
194.0
-60.0
-23.62%
jan 1, 2004
195.0
+1.0
0.52%
jan 1, 2005
249.0
+54.0
27.69%
jan 1, 2006
225.0
-24.0
-9.64%
jan 1, 2007
236.0
+11.0
4.89%
jan 1, 2008
248.0
+12.0
5.08%
jan 1, 2009
222.0
-26.0
-10.48%
jan 1, 2010
256.0
+34.0
15.32%
jan 1, 2011
183.0
-73.0
-28.52%
jan 1, 2012
138.0
-45.0
-24.59%
jan 1, 2013
139.0
+1.0
0.72%
jan 1, 2014
114.0
-25.0
-17.99%
jan 1, 2015
110.0
-4.0
-3.51%

Ranking of countries by current statistics by years