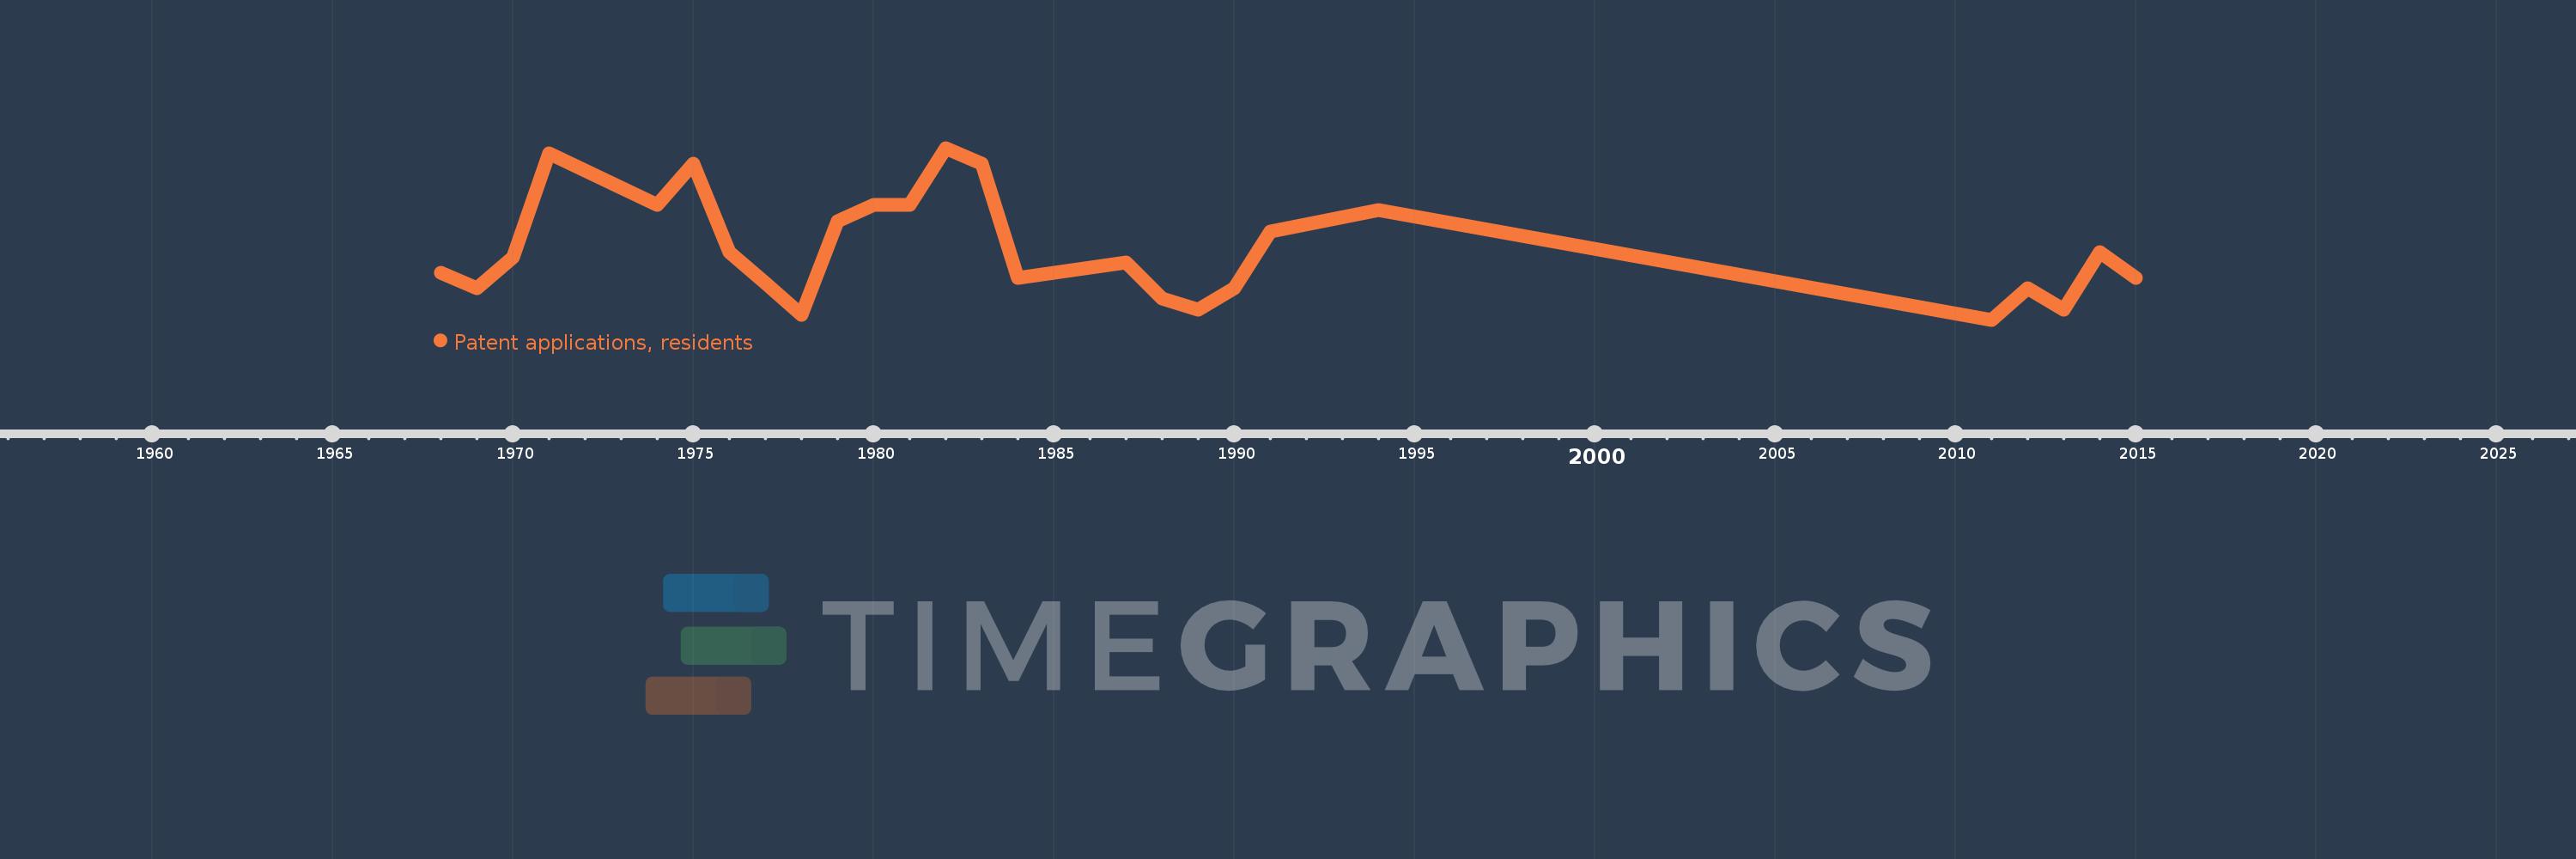
This timeline shows a graph from 1968 to 2015 of Costa Rica. No data until 1967. Number of actual observations by date: 26.
Source name:
World Development Indicators
Source organization:
World Intellectual Property Organization (WIPO), WIPO Patent Report: Statistics on Worldwide Patent Activity. The International Bureau of WIPO assumes no responsibility with respect to the transformation of these data.
Categories, topics:
Science & Technology
Last updated:
apr 23, 2017
Indicators value changes by year
Meaning:
21.692
Minimum:
8.0
jan 1, 2011
Maximum:
41.0
jan 1, 1982
At the date of observation
Value
Absolute change
Change from the previous value
jan 1, 1968
17.0
+17.0
0.0%
jan 1, 1969
14.0
-3.0
-17.65%
jan 1, 1970
20.0
+6.0
42.86%
jan 1, 1971
40.0
+20.0
100.0%
jan 1, 1974
30.0
-10.0
-25.0%
jan 1, 1975
38.0
+8.0
26.67%
jan 1, 1976
21.0
-17.0
-44.74%
jan 1, 1977
15.0
-6.0
-28.57%
jan 1, 1978
9.0
-6.0
-40.0%
jan 1, 1979
27.0
+18.0
200.0%
jan 1, 1980
30.0
+3.0
11.11%
jan 1, 1981
30.0
0.0
0.0%
jan 1, 1982
41.0
+11.0
36.67%
jan 1, 1983
38.0
-3.0
-7.32%
jan 1, 1984
16.0
-22.0
-57.89%
jan 1, 1987
19.0
+3.0
18.75%
jan 1, 1988
12.0
-7.0
-36.84%
jan 1, 1989
10.0
-2.0
-16.67%
jan 1, 1990
14.0
+4.0
40.0%
jan 1, 1991
25.0
+11.0
78.57%
jan 1, 1994
29.0
+4.0
16.0%
jan 1, 2011
8.0
-21.0
-72.41%
jan 1, 2012
14.0
+6.0
75.0%
jan 1, 2013
10.0
-4.0
-28.57%
jan 1, 2014
21.0
+11.0
110.0%
jan 1, 2015
16.0
-5.0
-23.81%
Ranking of countries by current statistics by years