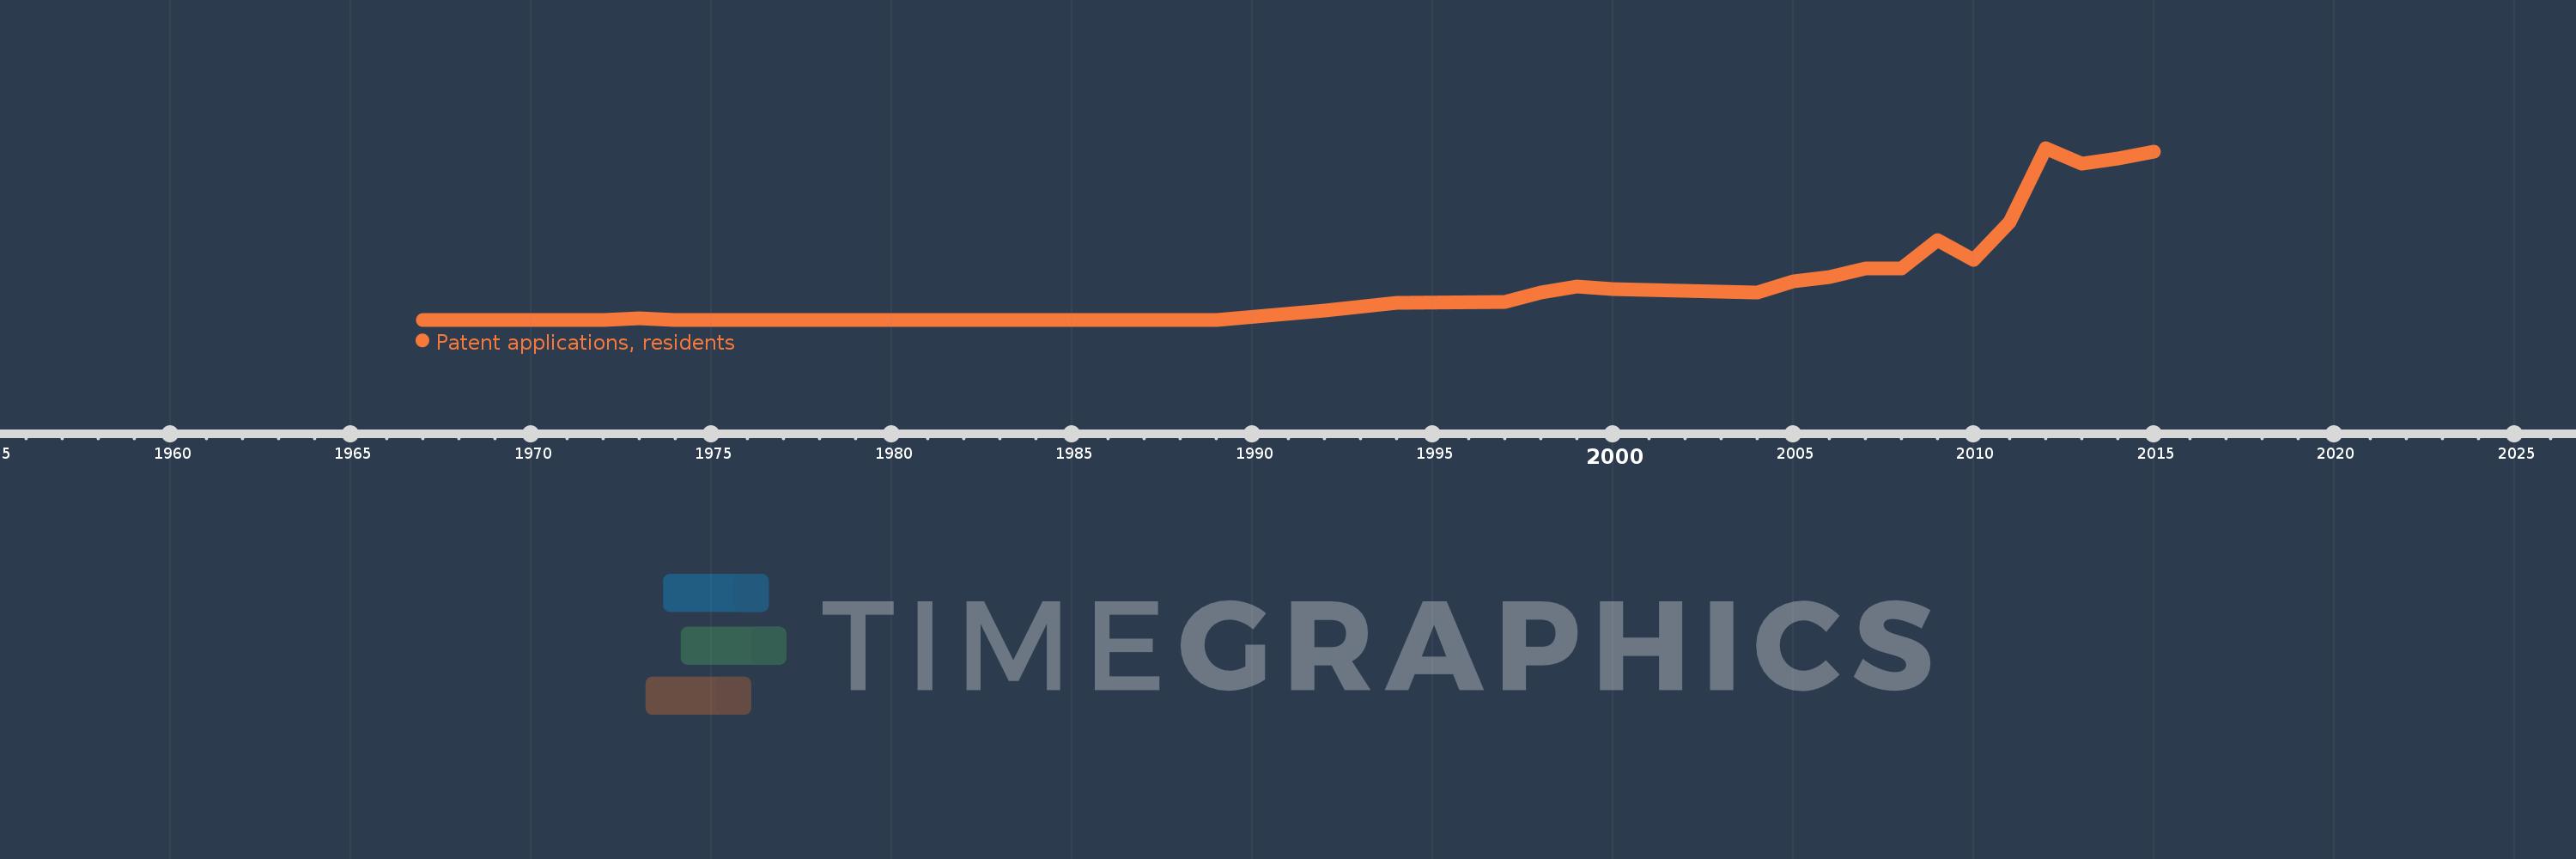
This timeline shows a graph from 1967 to 2015 of Kenya. No data until 1966. Number of actual observations by date: 24.
Source name:
World Development Indicators
Source organization:
World Intellectual Property Organization (WIPO), WIPO Patent Report: Statistics on Worldwide Patent Activity. The International Bureau of WIPO assumes no responsibility with respect to the transformation of these data.
Categories, topics:
Science & Technology
Last updated:
apr 23, 2017
Indicators value changes by year
Meaning:
42.25
Minimum:
1.0
jan 1, 1967
Maximum:
135.0
jan 1, 2012
At the date of observation
Value
Absolute change
Change from the previous value
jan 1, 1967
1.0
+1.0
0.0%
jan 1, 1972
1.0
0.0
0.0%
jan 1, 1973
2.0
+1.0
100.0%
jan 1, 1974
1.0
-1.0
-50.0%
jan 1, 1989
1.0
0.0
0.0%
jan 1, 1992
8.0
+7.0
700.0%
jan 1, 1994
14.0
+6.0
75.0%
jan 1, 1997
15.0
+1.0
7.14%
jan 1, 1998
22.0
+7.0
46.67%
jan 1, 1999
27.0
+5.0
22.73%
jan 1, 2000
25.0
-2.0
-7.41%
jan 1, 2003
23.0
-2.0
-8.0%
jan 1, 2004
22.0
-1.0
-4.35%
jan 1, 2005
31.0
+9.0
40.91%
jan 1, 2006
34.0
+3.0
9.68%
jan 1, 2007
41.0
+7.0
20.59%
jan 1, 2008
41.0
0.0
0.0%
jan 1, 2009
63.0
+22.0
53.66%
jan 1, 2010
48.0
-15.0
-23.81%
jan 1, 2011
77.0
+29.0
60.42%
jan 1, 2012
135.0
+58.0
75.32%
jan 1, 2013
123.0
-12.0
-8.89%
jan 1, 2014
127.0
+4.0
3.25%
jan 1, 2015
132.0
+5.0
3.94%
Ranking of countries by current statistics by years