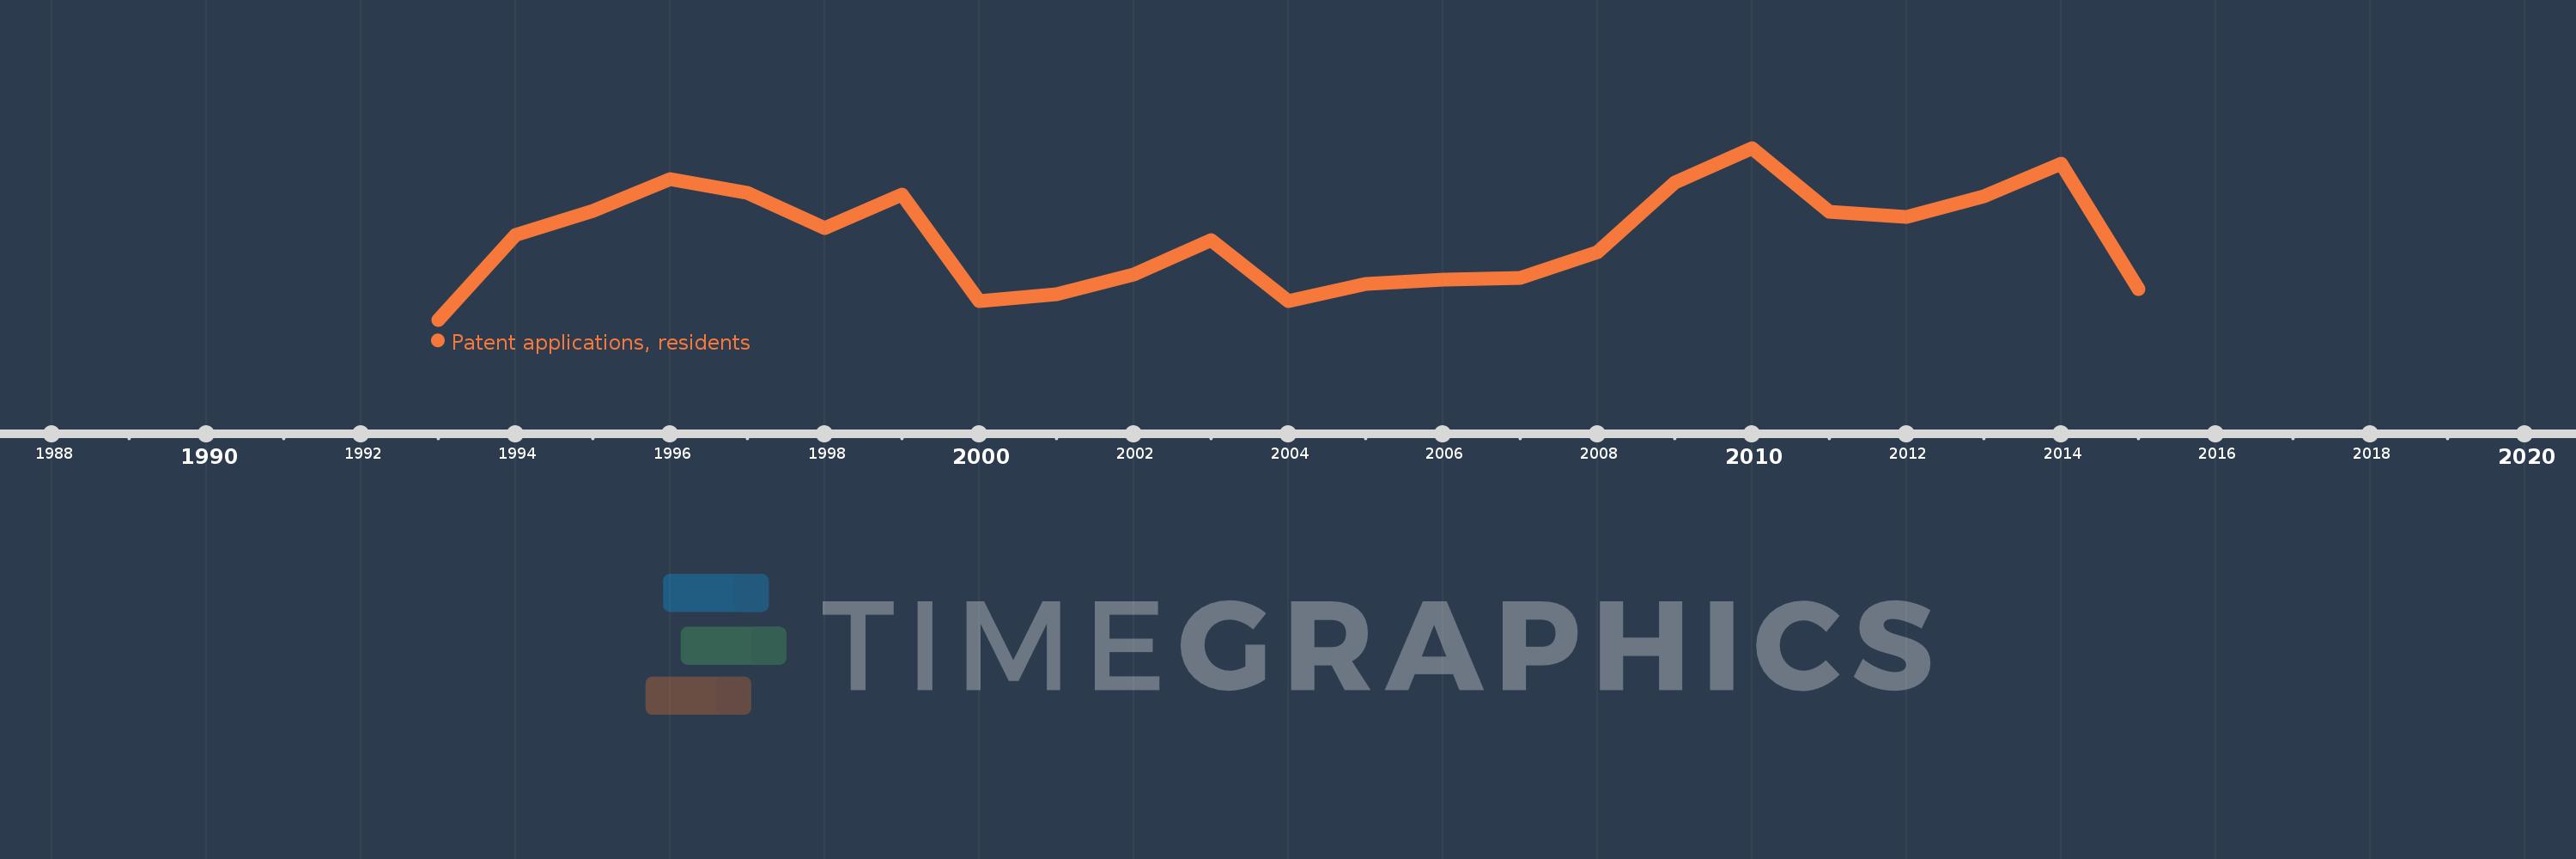
This timeline shows a graph from 1993 to 2015 of Latvia. No data until 1992. Number of actual observations by date: 23.
Source name:
World Development Indicators
Source organization:
World Intellectual Property Organization (WIPO), WIPO Patent Report: Statistics on Worldwide Patent Activity. The International Bureau of WIPO assumes no responsibility with respect to the transformation of these data.
Categories, topics:
Science & Technology
Last updated:
apr 23, 2017
Indicators value changes by year
Meaning:
152.522
Minimum:
73.0
jan 1, 1993
Maximum:
240.0
jan 1, 2010
At the date of observation
Value
Absolute change
Change from the previous value
jan 1, 1993
73.0
+73.0
0.0%
jan 1, 1994
155.0
+82.0
112.33%
jan 1, 1995
179.0
+24.0
15.48%
jan 1, 1996
210.0
+31.0
17.32%
jan 1, 1997
196.0
-14.0
-6.67%
jan 1, 1998
162.0
-34.0
-17.35%
jan 1, 1999
195.0
+33.0
20.37%
jan 1, 2000
91.0
-104.0
-53.33%
jan 1, 2001
98.0
+7.0
7.69%
jan 1, 2002
117.0
+19.0
19.39%
jan 1, 2003
150.0
+33.0
28.21%
jan 1, 2004
91.0
-59.0
-39.33%
jan 1, 2005
108.0
+17.0
18.68%
jan 1, 2006
112.0
+4.0
3.7%
jan 1, 2007
114.0
+2.0
1.79%
jan 1, 2008
139.0
+25.0
21.93%
jan 1, 2009
206.0
+67.0
48.2%
jan 1, 2010
240.0
+34.0
16.5%
jan 1, 2011
178.0
-62.0
-25.83%
jan 1, 2012
173.0
-5.0
-2.81%
jan 1, 2013
193.0
+20.0
11.56%
jan 1, 2014
225.0
+32.0
16.58%
jan 1, 2015
103.0
-122.0
-54.22%
Ranking of countries by current statistics by years