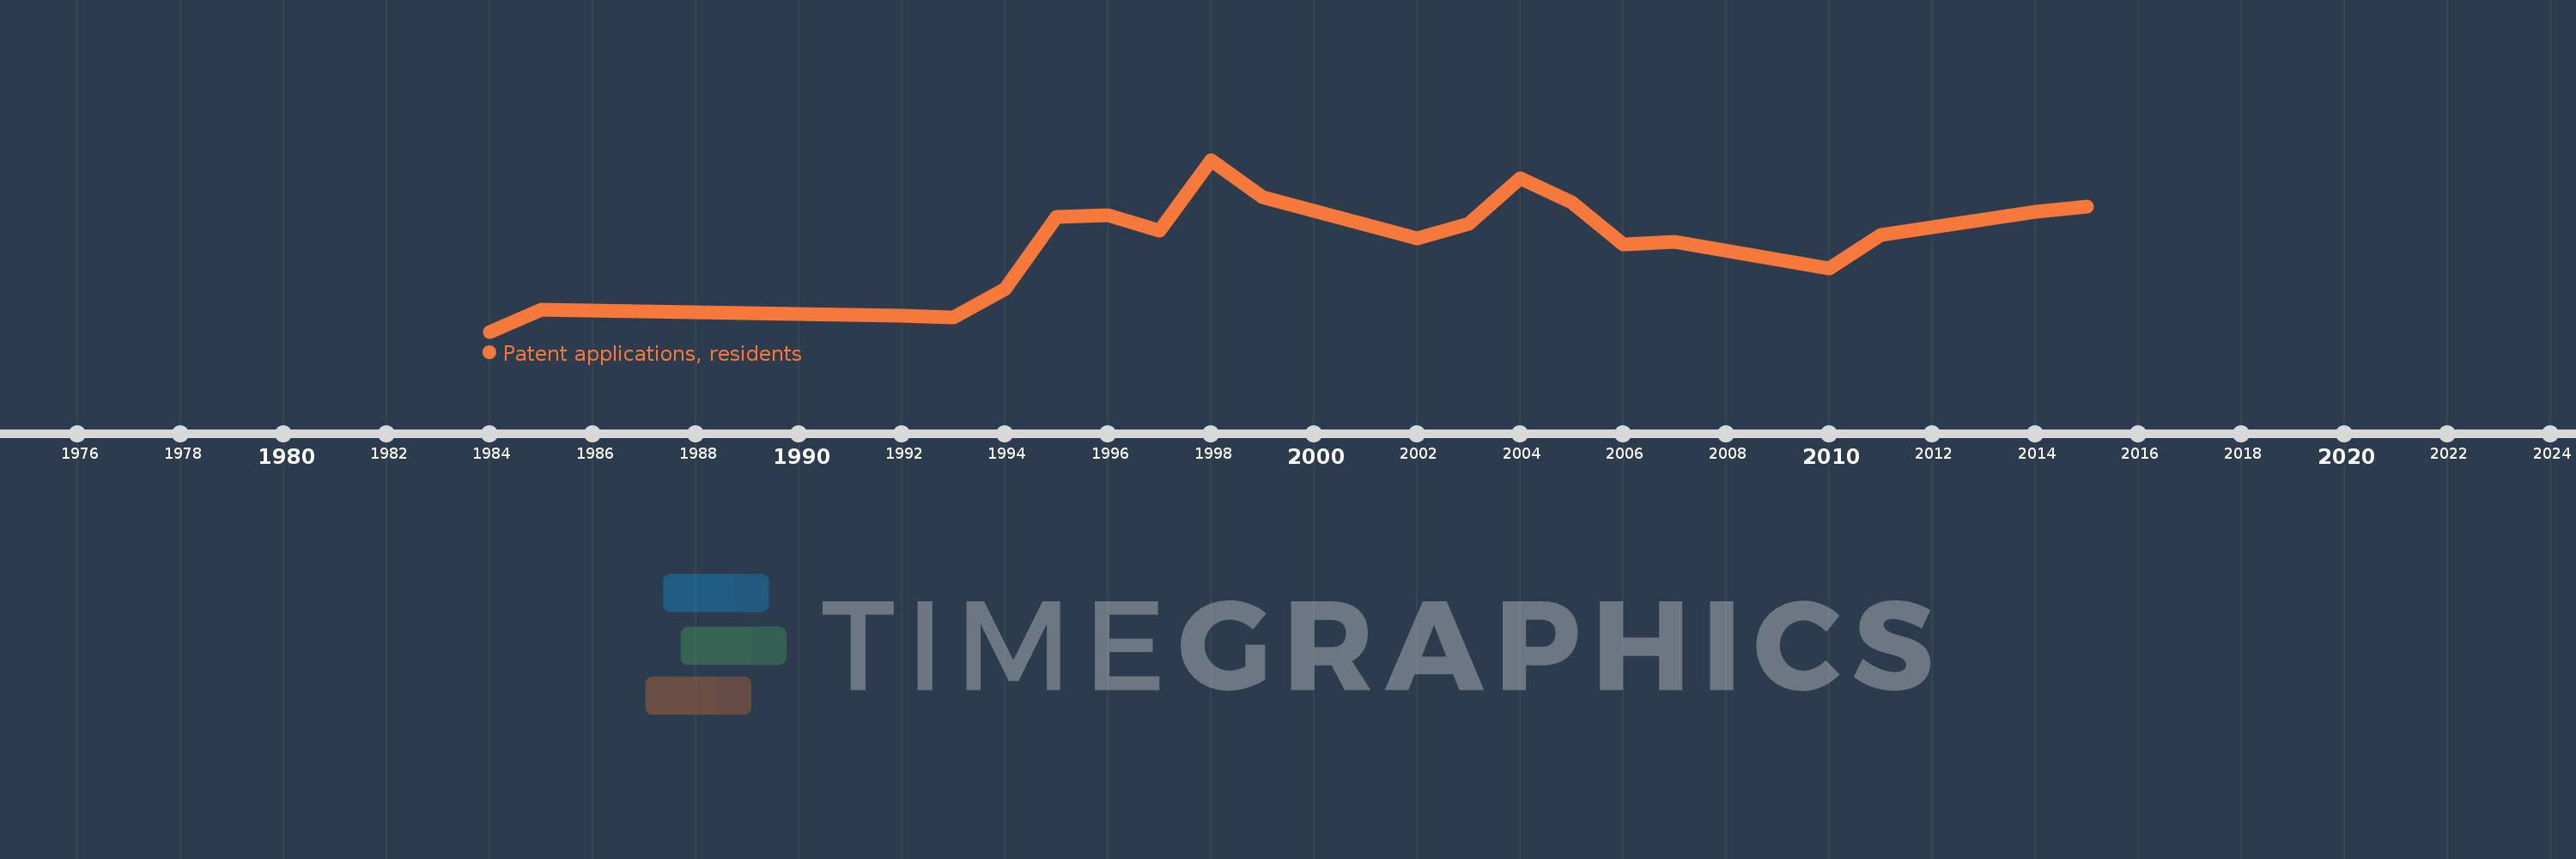
This timeline shows a graph from 1984 to 2015 of Mongolia. No data until 1983. Number of actual observations by date: 20.
Source name:
World Development Indicators
Source organization:
World Intellectual Property Organization (WIPO), WIPO Patent Report: Statistics on Worldwide Patent Activity. The International Bureau of WIPO assumes no responsibility with respect to the transformation of these data.
Categories, topics:
Science & Technology
Last updated:
apr 23, 2017
Indicators value changes by year
Meaning:
102.95
Minimum:
12.0
jan 1, 1984
Maximum:
186.0
jan 1, 1998
At the date of observation
Value
Absolute change
Change from the previous value
jan 1, 1984
12.0
+12.0
0.0%
jan 1, 1985
34.0
+22.0
183.33%
jan 1, 1992
28.0
-6.0
-17.65%
jan 1, 1993
26.0
-2.0
-7.14%
jan 1, 1994
55.0
+29.0
111.54%
jan 1, 1995
128.0
+73.0
132.73%
jan 1, 1996
130.0
+2.0
1.56%
jan 1, 1997
114.0
-16.0
-12.31%
jan 1, 1998
186.0
+72.0
63.16%
jan 1, 1999
148.0
-38.0
-20.43%
jan 1, 2002
106.0
-42.0
-28.38%
jan 1, 2003
121.0
+15.0
14.15%
jan 1, 2004
167.0
+46.0
38.02%
jan 1, 2005
143.0
-24.0
-14.37%
jan 1, 2006
100.0
-43.0
-30.07%
jan 1, 2007
103.0
+3.0
3.0%
jan 1, 2010
76.0
-27.0
-26.21%
jan 1, 2011
110.0
+34.0
44.74%
jan 1, 2014
133.0
+23.0
20.91%
jan 1, 2015
139.0
+6.0
4.51%
Ranking of countries by current statistics by years