30
/
AIzaSyAYiBZKx7MnpbEhh9jyipgxe19OcubqV5w
April 1, 2024
241988
Slovak Republic
SVK
true
2
1
Patent applications, residents
2015,2014,2013,2012,2011,2010,2009,2008,2007,2006,2005,2004,2003,2002,2001,2000,1999,1998,1997,1996,1995,1994
Download
Global statistics library →Slovak Republic →

Patent applications, residents

This statistics in other country:

AlbaniaAlgeriaAngolaArab WorldArgentinaArmeniaArubaAustraliaAustriaAzerbaijanBahamas, TheBahrainBangladeshBarbadosBelarusBelgiumBelizeBhutanBoliviaBosnia and HerzegovinaBotswanaBrazilBrunei DarussalamBulgariaBurkina FasoBurundiCambodiaCanadaCaribbean small statesCentral Europe and the BalticsChileChinaColombiaCongo, Dem. Rep.Congo, Rep.Costa RicaCote d'IvoireCroatiaCubaCyprusCzech RepublicDenmarkDjiboutiDominican RepublicEarly-demographic dividendEast Asia & PacificEast Asia & Pacific (excluding high income)East Asia & Pacific (IDA & IBRD countries)EcuadorEgypt, Arab Rep.El SalvadorEstoniaEthiopiaEuro areaEurope & Central AsiaEurope & Central Asia (excluding high income)Europe & Central Asia (IDA & IBRD countries)European UnionFijiFinlandFranceGeorgiaGermanyGreeceGuatemalaGuyanaHaitiHigh incomeHondurasHong Kong SAR, ChinaHungaryIBRD onlyIcelandIDA & IBRD totalIDA blendIndiaIndonesiaIran, Islamic Rep.IraqIrelandIsraelItalyJamaicaJapanJordanKazakhstanKenyaKiribatiKorea, Dem. People’s Rep.Korea, Rep.KuwaitKyrgyz RepublicLao PDRLate-demographic dividendLatin America & Caribbean Latin America & Caribbean (excluding high income)Latin America & the Caribbean (IDA & IBRD countries)LatviaLebanonLesothoLiberiaLibyaLithuaniaLow & middle incomeLower middle incomeLuxembourgMacao SAR, ChinaMacedonia, FYRMadagascarMalawiMalaysiaMaliMaltaMauritiusMexicoMiddle East & North AfricaMiddle East & North Africa (excluding high income)Middle East & North Africa (IDA & IBRD countries)Middle incomeMoldovaMonacoMongoliaMontenegroMoroccoMozambiqueNamibiaNepalNetherlandsNew ZealandNicaraguaNigeriaNorth AmericaNorwayOECD membersPakistanPanamaPapua New GuineaParaguayPeruPhilippinesPolandPortugalPost-demographic dividendQatarRomaniaRussian FederationRwandaSamoaSaudi ArabiaSerbiaSierra LeoneSingaporeSlovak RepublicSloveniaSomaliaSouth AfricaSouth AsiaSouth Asia (IDA & IBRD)SpainSri LankaSudanSwazilandSwedenSwitzerlandSyrian Arab RepublicTajikistanTanzaniaThailandTrinidad and TobagoTunisiaTurkeyTurkmenistanUgandaUkraineUnited Arab EmiratesUnited KingdomUnited StatesUpper middle incomeUruguayUzbekistanVenezuela, RBVietnamWorldYemen, Rep.ZambiaZimbabwe

Timeline:

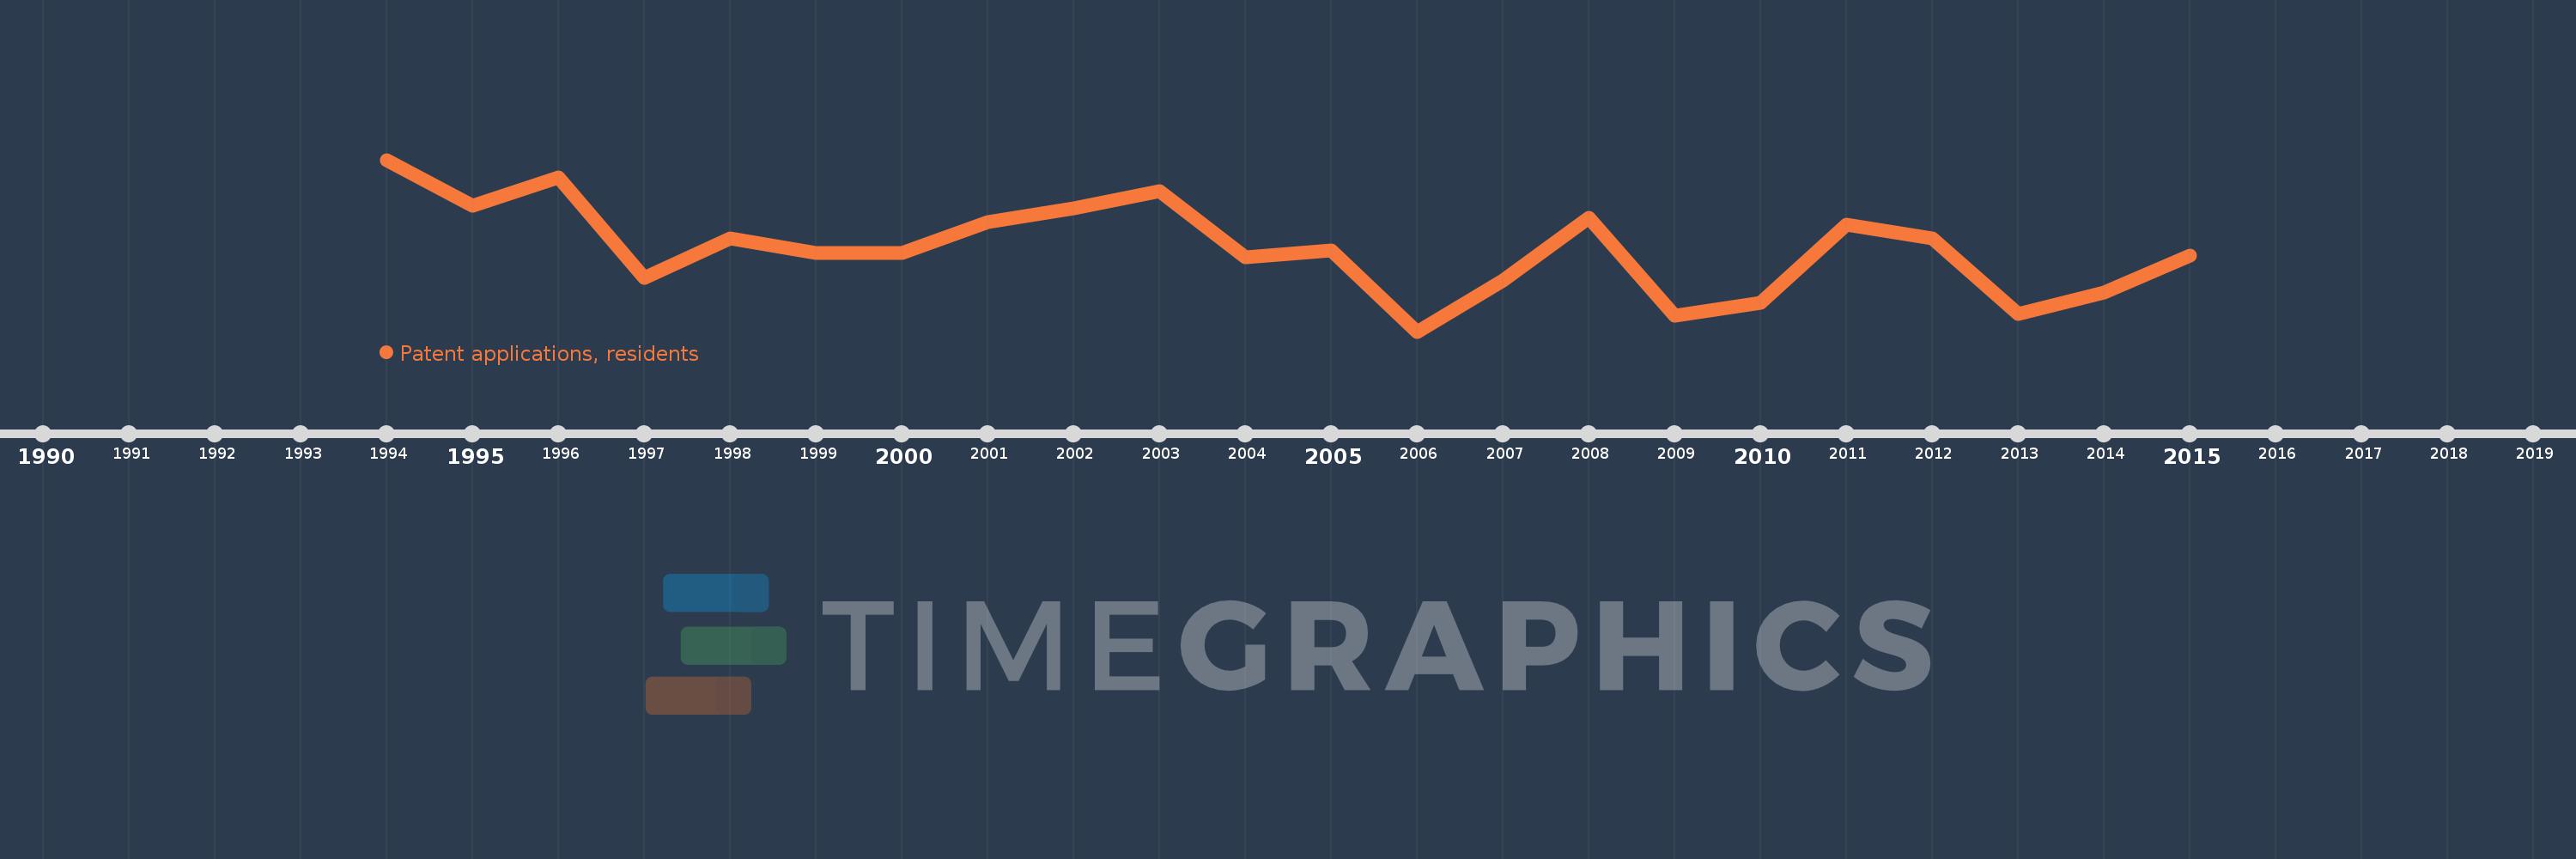
This timeline shows a graph from 1994 to 2015 of Slovak Republic. No data until 1993. Number of actual observations by date: 22.

Source name:

World Development Indicators

Source organization:

World Intellectual Property Organization (WIPO), WIPO Patent Report: Statistics on Worldwide Patent Activity. The International Bureau of WIPO assumes no responsibility with respect to the transformation of these data.

Categories, topics:

Science & Technology

Last updated:

apr 23, 2017

Indicators value changes by year

Meaning:
216.409
Minimum:
155.0
jan 1, 2006
Maximum:
282.0
jan 1, 1994
At the date of observation
Value
Absolute change
Change from the previous value
jan 1, 1994
282.0
+282.0
0.0%
jan 1, 1995
248.0
-34.0
-12.06%
jan 1, 1996
269.0
+21.0
8.47%
jan 1, 1997
195.0
-74.0
-27.51%
jan 1, 1998
224.0
+29.0
14.87%
jan 1, 1999
213.0
-11.0
-4.91%
jan 1, 2000
213.0
0.0
0.0%
jan 1, 2001
236.0
+23.0
10.8%
jan 1, 2002
246.0
+10.0
4.24%
jan 1, 2003
259.0
+13.0
5.28%
jan 1, 2004
210.0
-49.0
-18.92%
jan 1, 2005
215.0
+5.0
2.38%
jan 1, 2006
155.0
-60.0
-27.91%
jan 1, 2007
193.0
+38.0
24.52%
jan 1, 2008
239.0
+46.0
23.83%
jan 1, 2009
167.0
-72.0
-30.13%
jan 1, 2010
176.0
+9.0
5.39%
jan 1, 2011
234.0
+58.0
32.95%
jan 1, 2012
224.0
-10.0
-4.27%
jan 1, 2013
168.0
-56.0
-25.0%
jan 1, 2014
184.0
+16.0
9.52%
jan 1, 2015
211.0
+27.0
14.67%

Ranking of countries by current statistics by years