33
/
AIzaSyB4mHJ5NPEv-XzF7P6NDYXjlkCWaeKw5bc
November 30, 2025
281441
Venezuela, RB
VEN
true
2
1
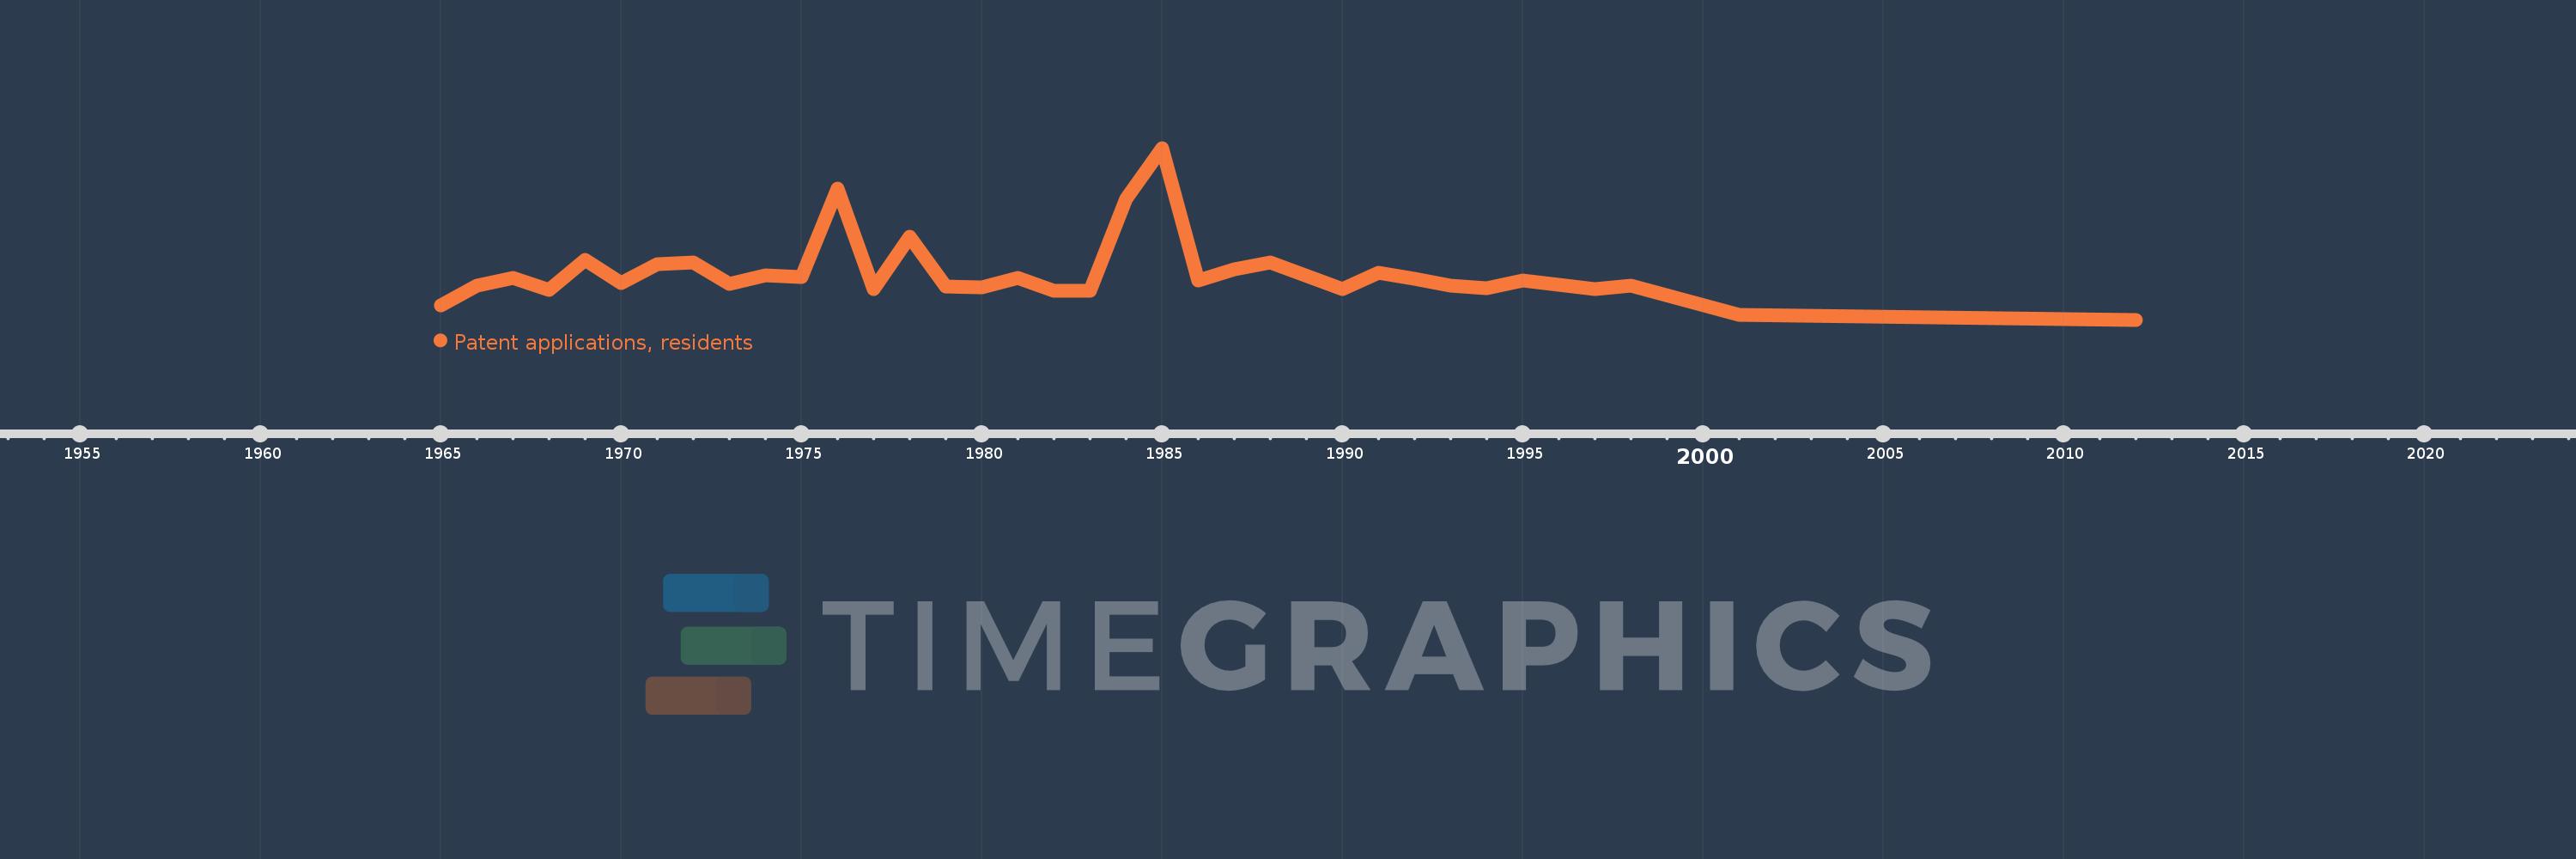
Patent applications, residents
2012,2001,1998,1997,1995,1994,1993,1992,1991,1990,1988,1987,1986,1985,1984,1983,1982,1981,1980,1979,1978,1977,1976,1975,1974,1973,1972,1971,1970,1969,1968,1967,1966,1965