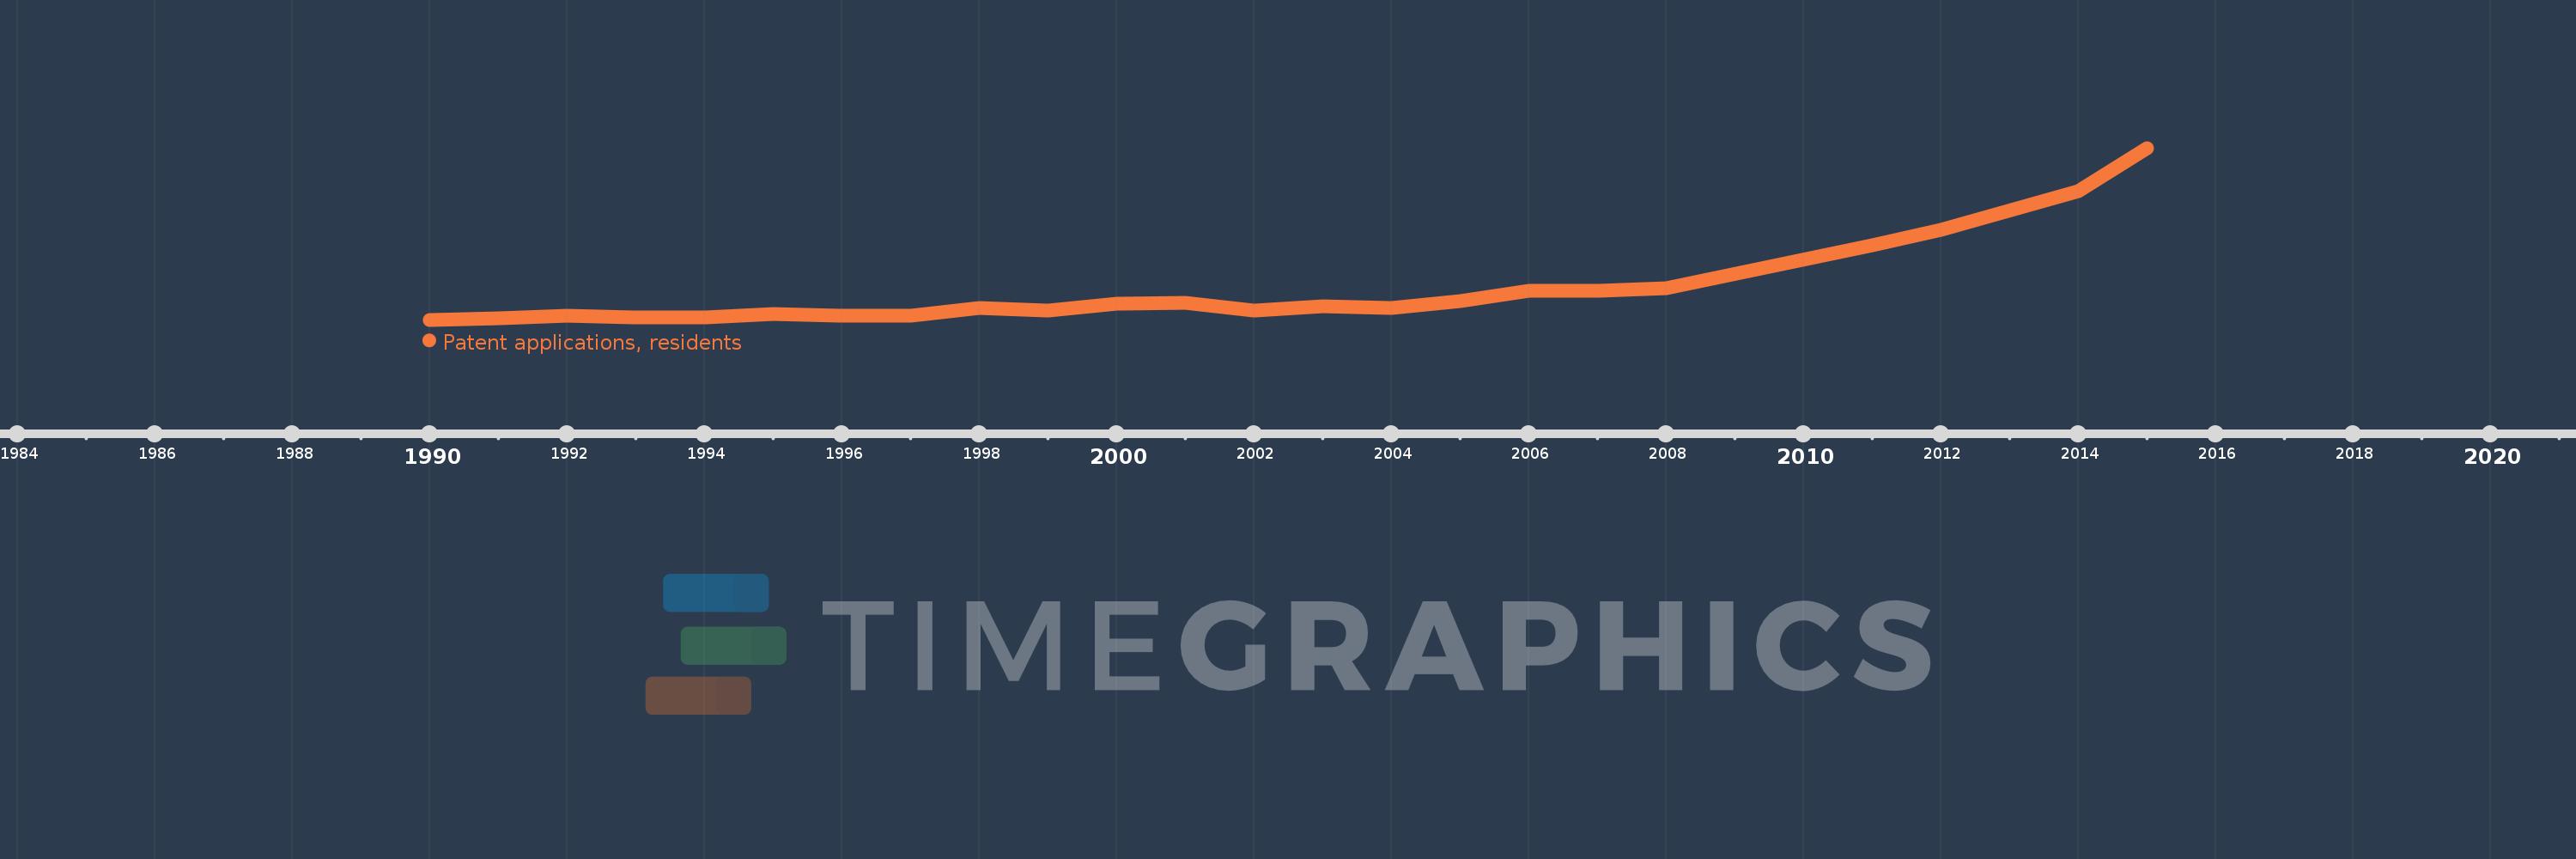
This timeline shows a graph from 1990 to 2015 of Saudi Arabia. No data until 1989. Number of actual observations by date: 23.
Source name:
World Development Indicators
Source organization:
World Intellectual Property Organization (WIPO), WIPO Patent Report: Statistics on Worldwide Patent Activity. The International Bureau of WIPO assumes no responsibility with respect to the transformation of these data.
Categories, topics:
Science & Technology
Last updated:
apr 23, 2017
Indicators value changes by year
Meaning:
122.739
Minimum:
12.0
jan 1, 1990
Maximum:
652.0
jan 1, 2015
At the date of observation
Value
Absolute change
Change from the previous value
jan 1, 1990
12.0
+12.0
0.0%
jan 1, 1991
16.0
+4.0
33.33%
jan 1, 1992
27.0
+11.0
68.75%
jan 1, 1993
21.0
-6.0
-22.22%
jan 1, 1994
21.0
0.0
0.0%
jan 1, 1995
33.0
+12.0
57.14%
jan 1, 1996
28.0
-5.0
-15.15%
jan 1, 1997
27.0
-1.0
-3.57%
jan 1, 1998
57.0
+30.0
111.11%
jan 1, 1999
45.0
-12.0
-21.05%
jan 1, 2000
72.0
+27.0
60.0%
jan 1, 2001
76.0
+4.0
5.56%
jan 1, 2002
46.0
-30.0
-39.47%
jan 1, 2003
61.0
+15.0
32.61%
jan 1, 2004
56.0
-5.0
-8.2%
jan 1, 2005
81.0
+25.0
44.64%
jan 1, 2006
119.0
+38.0
46.91%
jan 1, 2007
119.0
0.0
0.0%
jan 1, 2008
128.0
+9.0
7.56%
jan 1, 2011
288.0
+160.0
125.0%
jan 1, 2012
347.0
+59.0
20.49%
jan 1, 2014
491.0
+144.0
41.5%
jan 1, 2015
652.0
+161.0
32.79%
Ranking of countries by current statistics by years