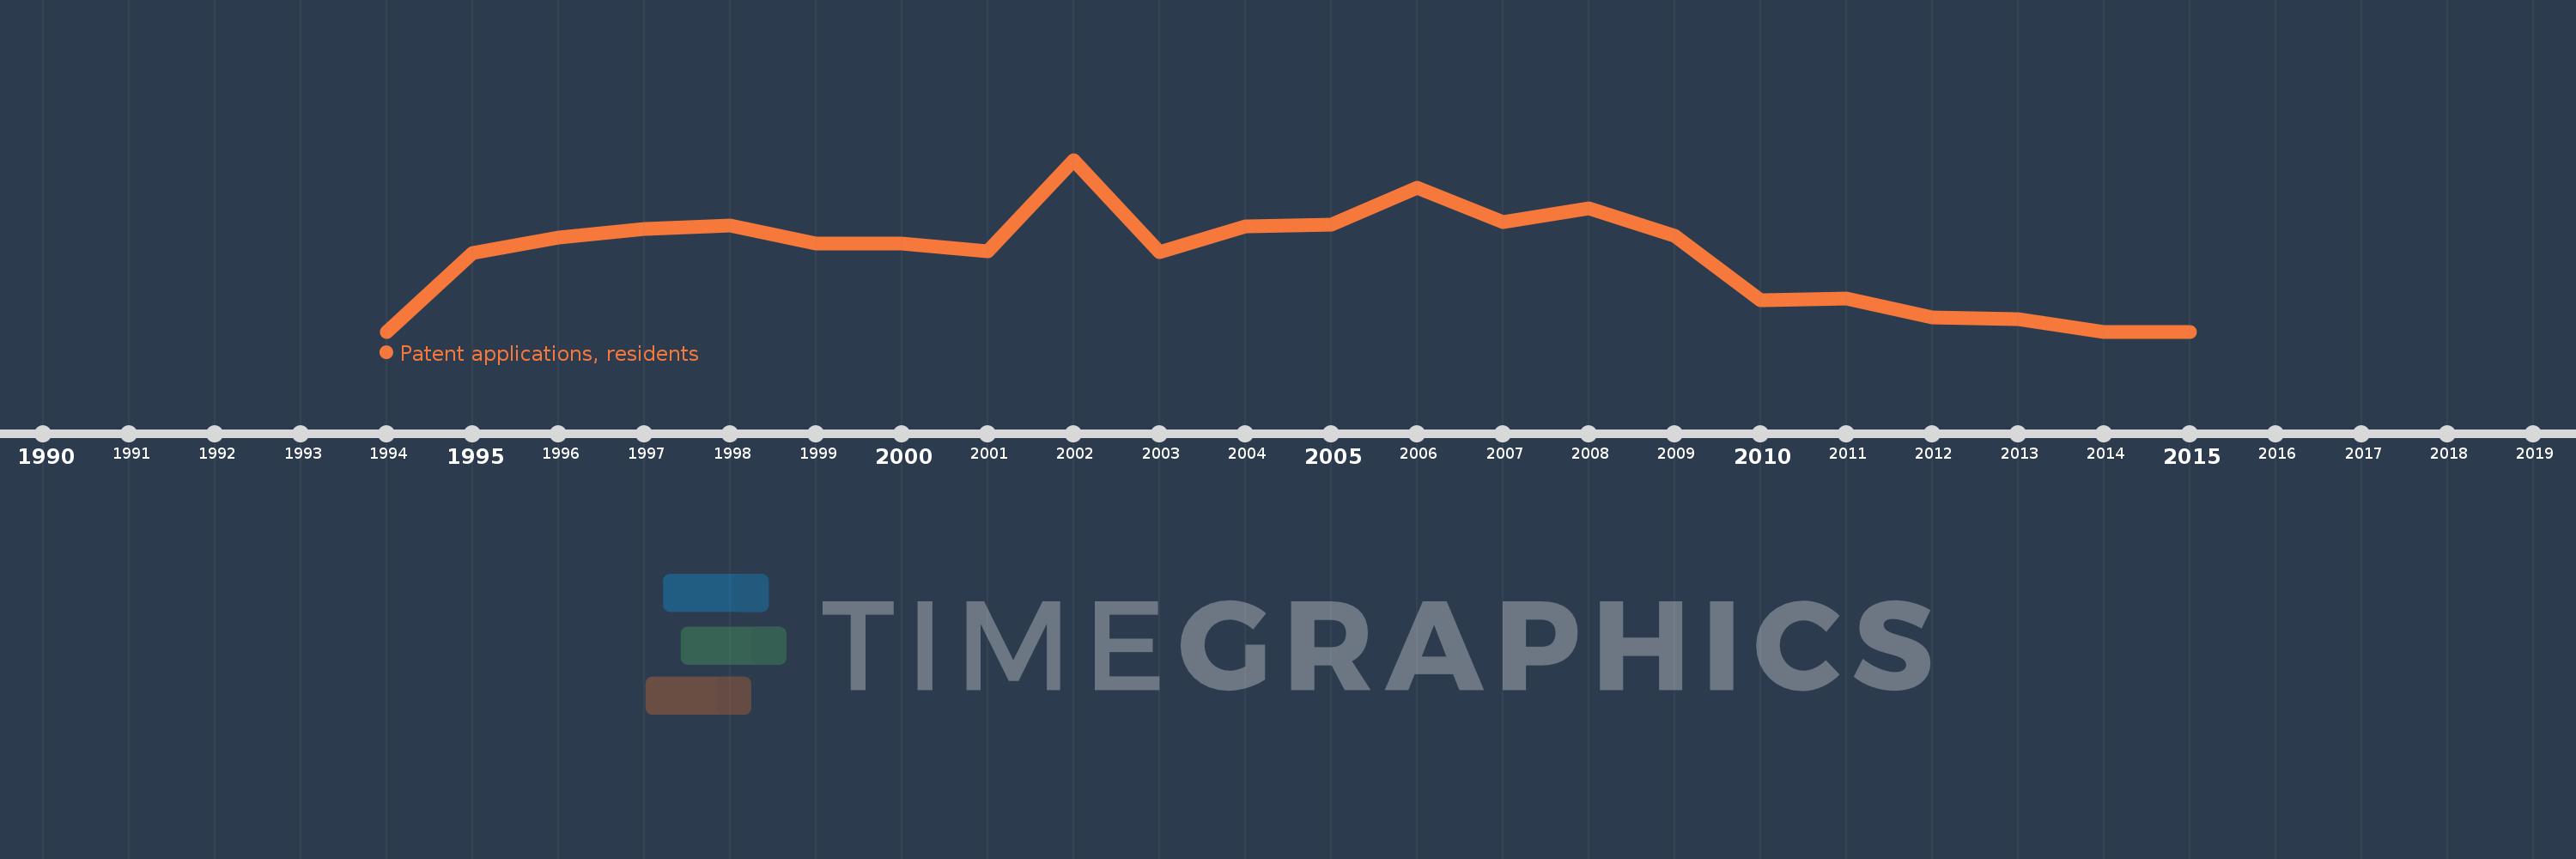
This timeline shows a graph from 1994 to 2015 of Moldova. No data until 1993. Number of actual observations by date: 22.
Source name:
World Development Indicators
Source organization:
World Intellectual Property Organization (WIPO), WIPO Patent Report: Statistics on Worldwide Patent Activity. The International Bureau of WIPO assumes no responsibility with respect to the transformation of these data.
Categories, topics:
Science & Technology
Last updated:
apr 23, 2017
Indicators value changes by year
Meaning:
230.0
Minimum:
67.0
jan 1, 1994
Maximum:
437.0
jan 1, 2002
At the date of observation
Value
Absolute change
Change from the previous value
jan 1, 1994
67.0
+67.0
0.0%
jan 1, 1995
237.0
+170.0
253.73%
jan 1, 1996
270.0
+33.0
13.92%
jan 1, 1997
289.0
+19.0
7.04%
jan 1, 1998
295.0
+6.0
2.08%
jan 1, 1999
257.0
-38.0
-12.88%
jan 1, 2000
256.0
-1.0
-0.39%
jan 1, 2001
240.0
-16.0
-6.25%
jan 1, 2002
437.0
+197.0
82.08%
jan 1, 2003
239.0
-198.0
-45.31%
jan 1, 2004
293.0
+54.0
22.59%
jan 1, 2005
297.0
+4.0
1.37%
jan 1, 2006
377.0
+80.0
26.94%
jan 1, 2007
303.0
-74.0
-19.63%
jan 1, 2008
333.0
+30.0
9.9%
jan 1, 2009
273.0
-60.0
-18.02%
jan 1, 2010
134.0
-139.0
-50.92%
jan 1, 2011
139.0
+5.0
3.73%
jan 1, 2012
97.0
-42.0
-30.22%
jan 1, 2013
93.0
-4.0
-4.12%
jan 1, 2014
67.0
-26.0
-27.96%
jan 1, 2015
67.0
0.0
0.0%
Ranking of countries by current statistics by years