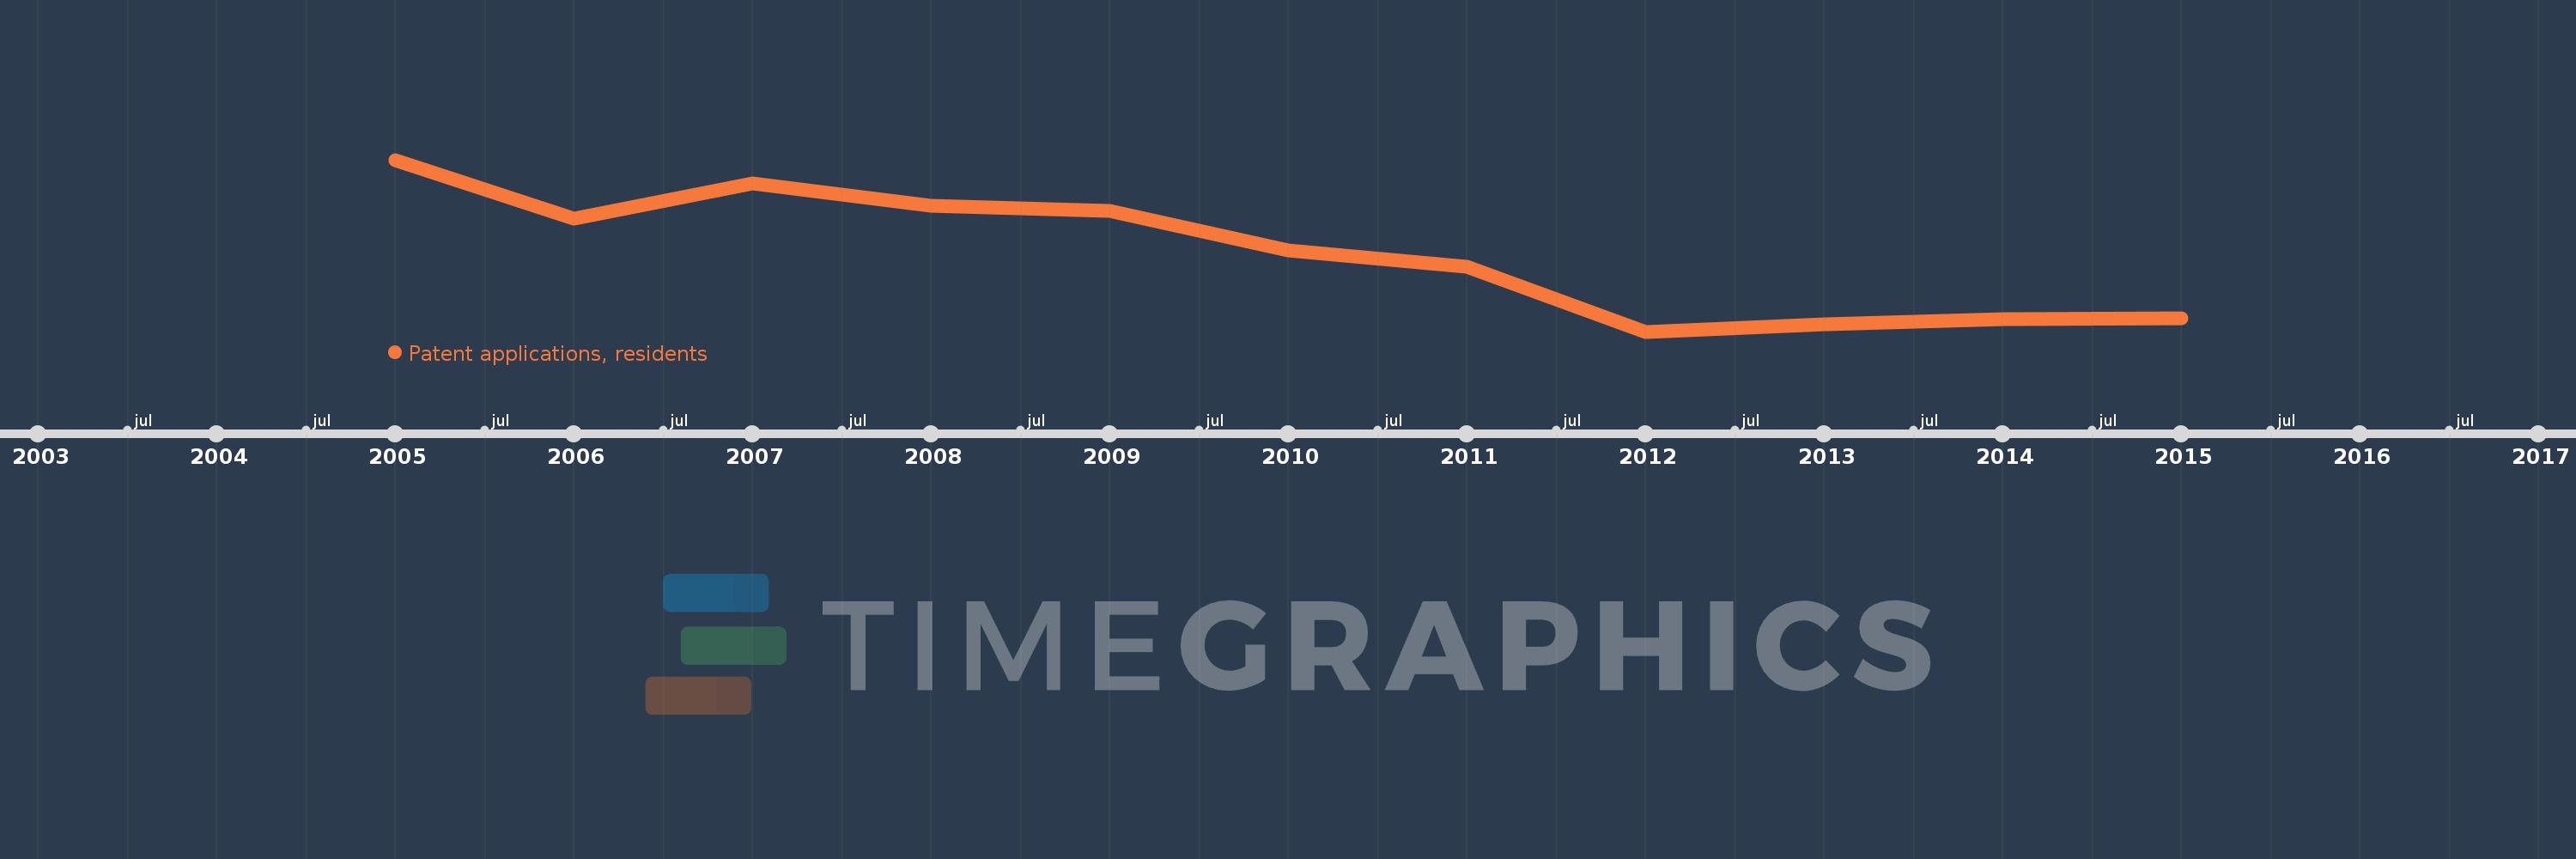
This timeline shows a graph from 2005 to 2015 of Serbia. No data until 2004. Number of actual observations by date: 11.
Source name:
World Development Indicators
Source organization:
World Intellectual Property Organization (WIPO), WIPO Patent Report: Statistics on Worldwide Patent Activity. The International Bureau of WIPO assumes no responsibility with respect to the transformation of these data.
Categories, topics:
Science & Technology
Last updated:
apr 23, 2017
Indicators value changes by year
Meaning:
312.909
Minimum:
180.0
jan 1, 2012
Maximum:
473.0
jan 1, 2005
At the date of observation
Value
Absolute change
Change from the previous value
jan 1, 2005
473.0
+473.0
0.0%
jan 1, 2006
372.0
-101.0
-21.35%
jan 1, 2007
432.0
+60.0
16.13%
jan 1, 2008
395.0
-37.0
-8.56%
jan 1, 2009
386.0
-9.0
-2.28%
jan 1, 2010
319.0
-67.0
-17.36%
jan 1, 2011
290.0
-29.0
-9.09%
jan 1, 2012
180.0
-110.0
-37.93%
jan 1, 2013
192.0
+12.0
6.67%
jan 1, 2014
201.0
+9.0
4.69%
jan 1, 2015
202.0
+1.0
0.5%
Ranking of countries by current statistics by years