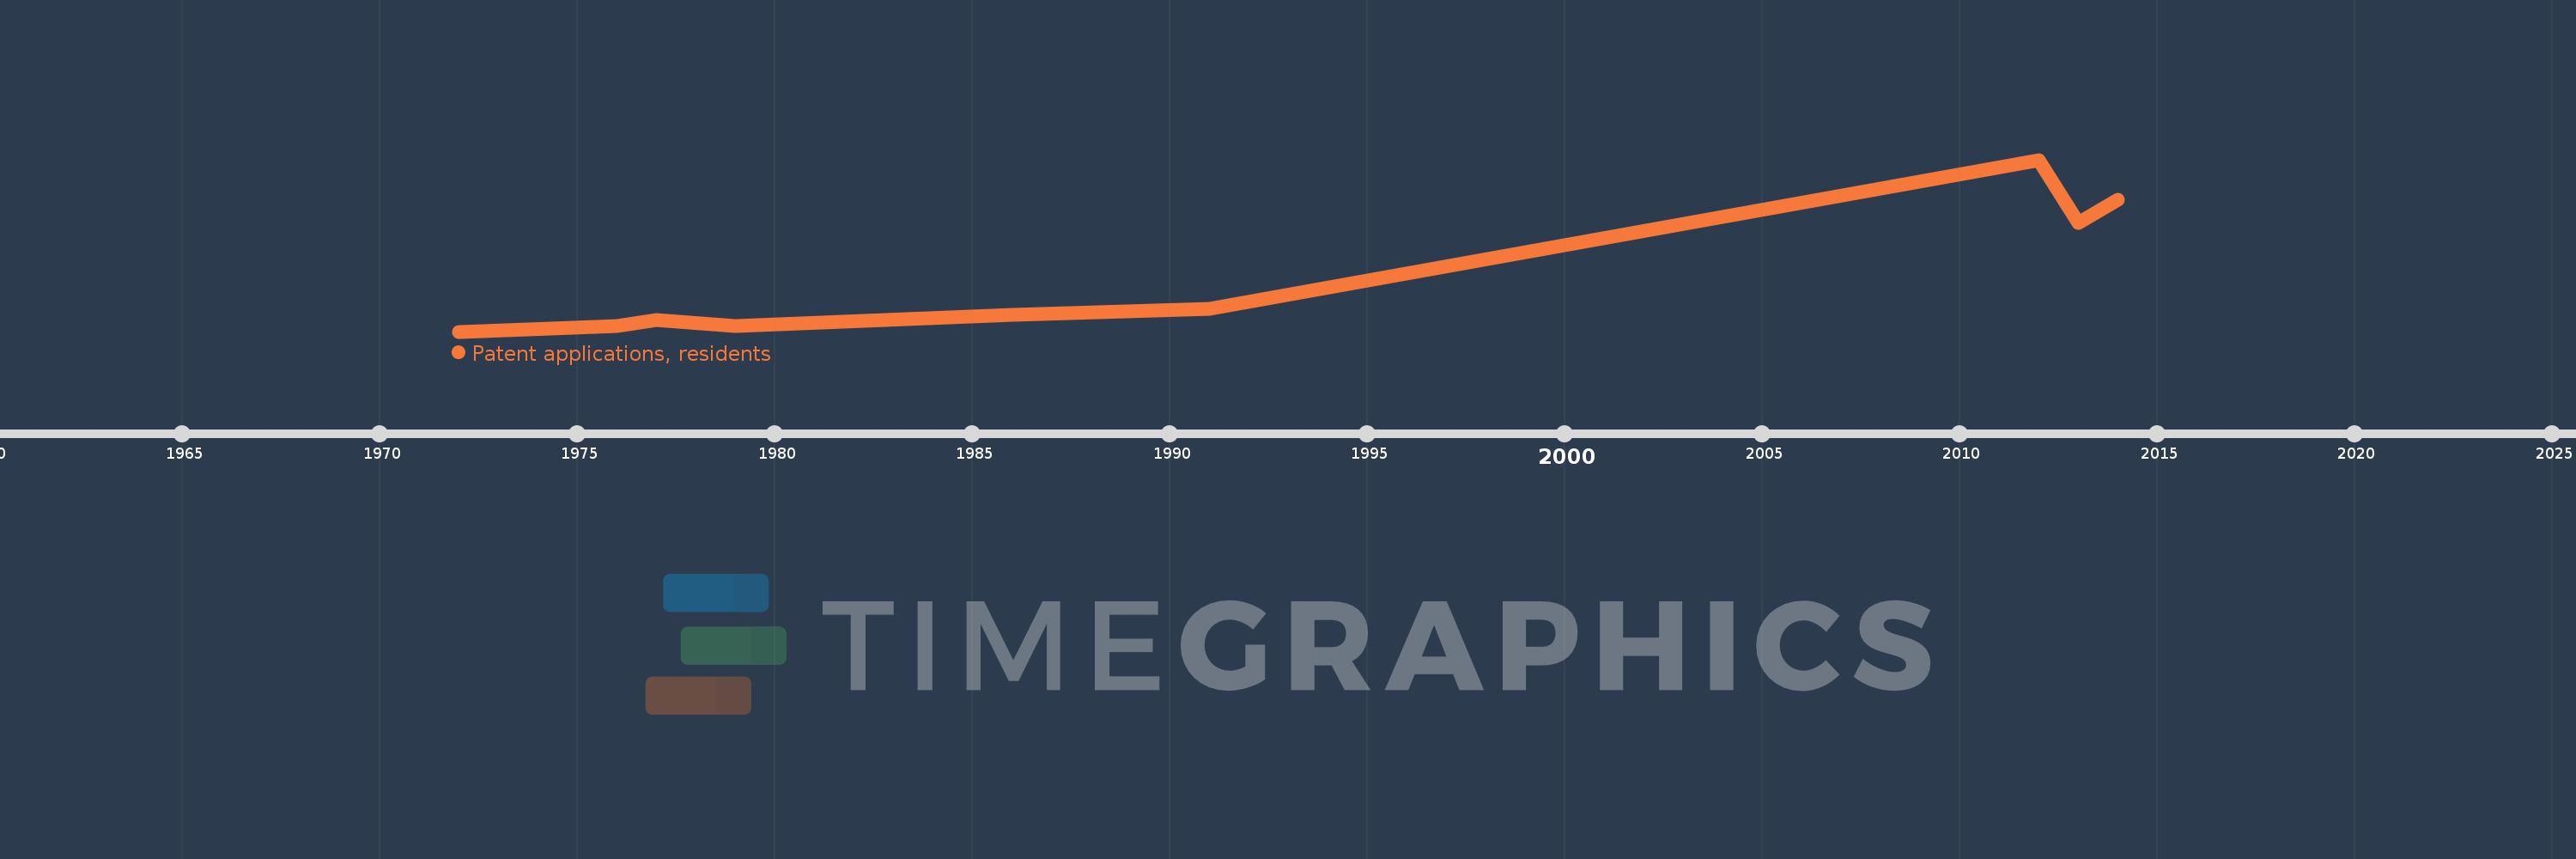
This timeline shows a graph from 1972 to 2014 of Nigeria. No data until 1971. Number of actual observations by date: 9.
Source name:
World Development Indicators
Source organization:
World Intellectual Property Organization (WIPO), WIPO Patent Report: Statistics on Worldwide Patent Activity. The International Bureau of WIPO assumes no responsibility with respect to the transformation of these data.
Categories, topics:
Science & Technology
Last updated:
apr 23, 2017
Indicators value changes by year
Meaning:
22.444
Minimum:
4.0
jan 1, 1972
Maximum:
64.0
jan 1, 2012
At the date of observation
Value
Absolute change
Change from the previous value
jan 1, 1972
4.0
+4.0
0.0%
jan 1, 1976
6.0
+2.0
50.0%
jan 1, 1977
8.0
+2.0
33.33%
jan 1, 1979
6.0
-2.0
-25.0%
jan 1, 1986
10.0
+4.0
66.67%
jan 1, 1991
12.0
+2.0
20.0%
jan 1, 2012
64.0
+52.0
433.33%
jan 1, 2013
42.0
-22.0
-34.38%
jan 1, 2014
50.0
+8.0
19.05%
Ranking of countries by current statistics by years