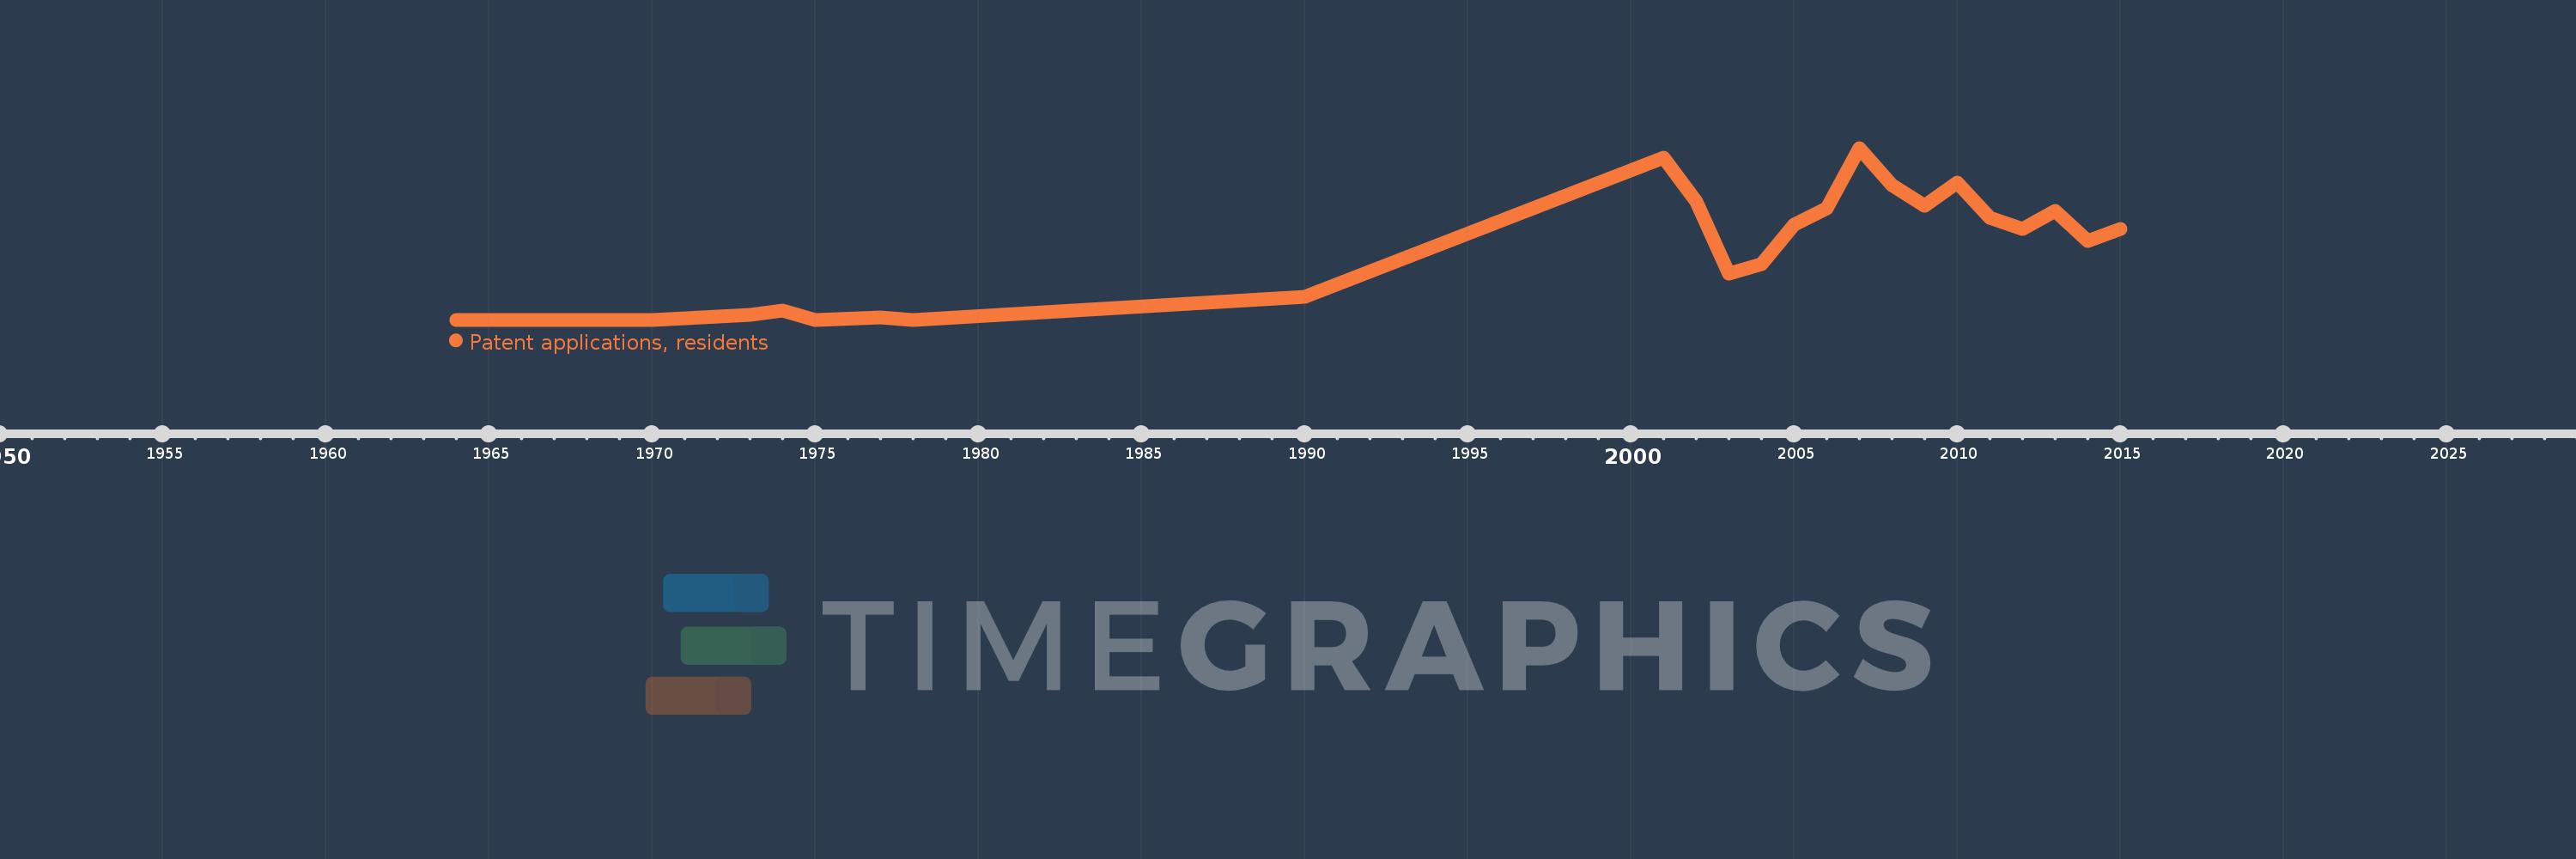
This timeline shows a graph from 1964 to 2015 of Jordan. No data until 1963. Number of actual observations by date: 23.
Source name:
World Development Indicators
Source organization:
World Intellectual Property Organization (WIPO), WIPO Patent Report: Statistics on Worldwide Patent Activity. The International Bureau of WIPO assumes no responsibility with respect to the transformation of these data.
Categories, topics:
Science & Technology
Last updated:
apr 23, 2017
Indicators value changes by year
Meaning:
32.043
Minimum:
1.0
jan 1, 1964
Maximum:
75.0
jan 1, 2007
At the date of observation
Value
Absolute change
Change from the previous value
jan 1, 1964
1.0
+1.0
0.0%
jan 1, 1970
1.0
0.0
0.0%
jan 1, 1973
3.0
+2.0
200.0%
jan 1, 1974
5.0
+2.0
66.67%
jan 1, 1975
1.0
-4.0
-80.0%
jan 1, 1977
2.0
+1.0
100.0%
jan 1, 1978
1.0
-1.0
-50.0%
jan 1, 1990
11.0
+10.0
1000.0%
jan 1, 2001
71.0
+60.0
545.45%
jan 1, 2002
52.0
-19.0
-26.76%
jan 1, 2003
21.0
-31.0
-59.62%
jan 1, 2004
25.0
+4.0
19.05%
jan 1, 2005
42.0
+17.0
68.0%
jan 1, 2006
49.0
+7.0
16.67%
jan 1, 2007
75.0
+26.0
53.06%
jan 1, 2008
59.0
-16.0
-21.33%
jan 1, 2009
50.0
-9.0
-15.25%
jan 1, 2010
60.0
+10.0
20.0%
jan 1, 2011
45.0
-15.0
-25.0%
jan 1, 2012
40.0
-5.0
-11.11%
jan 1, 2013
48.0
+8.0
20.0%
jan 1, 2014
35.0
-13.0
-27.08%
jan 1, 2015
40.0
+5.0
14.29%
Ranking of countries by current statistics by years