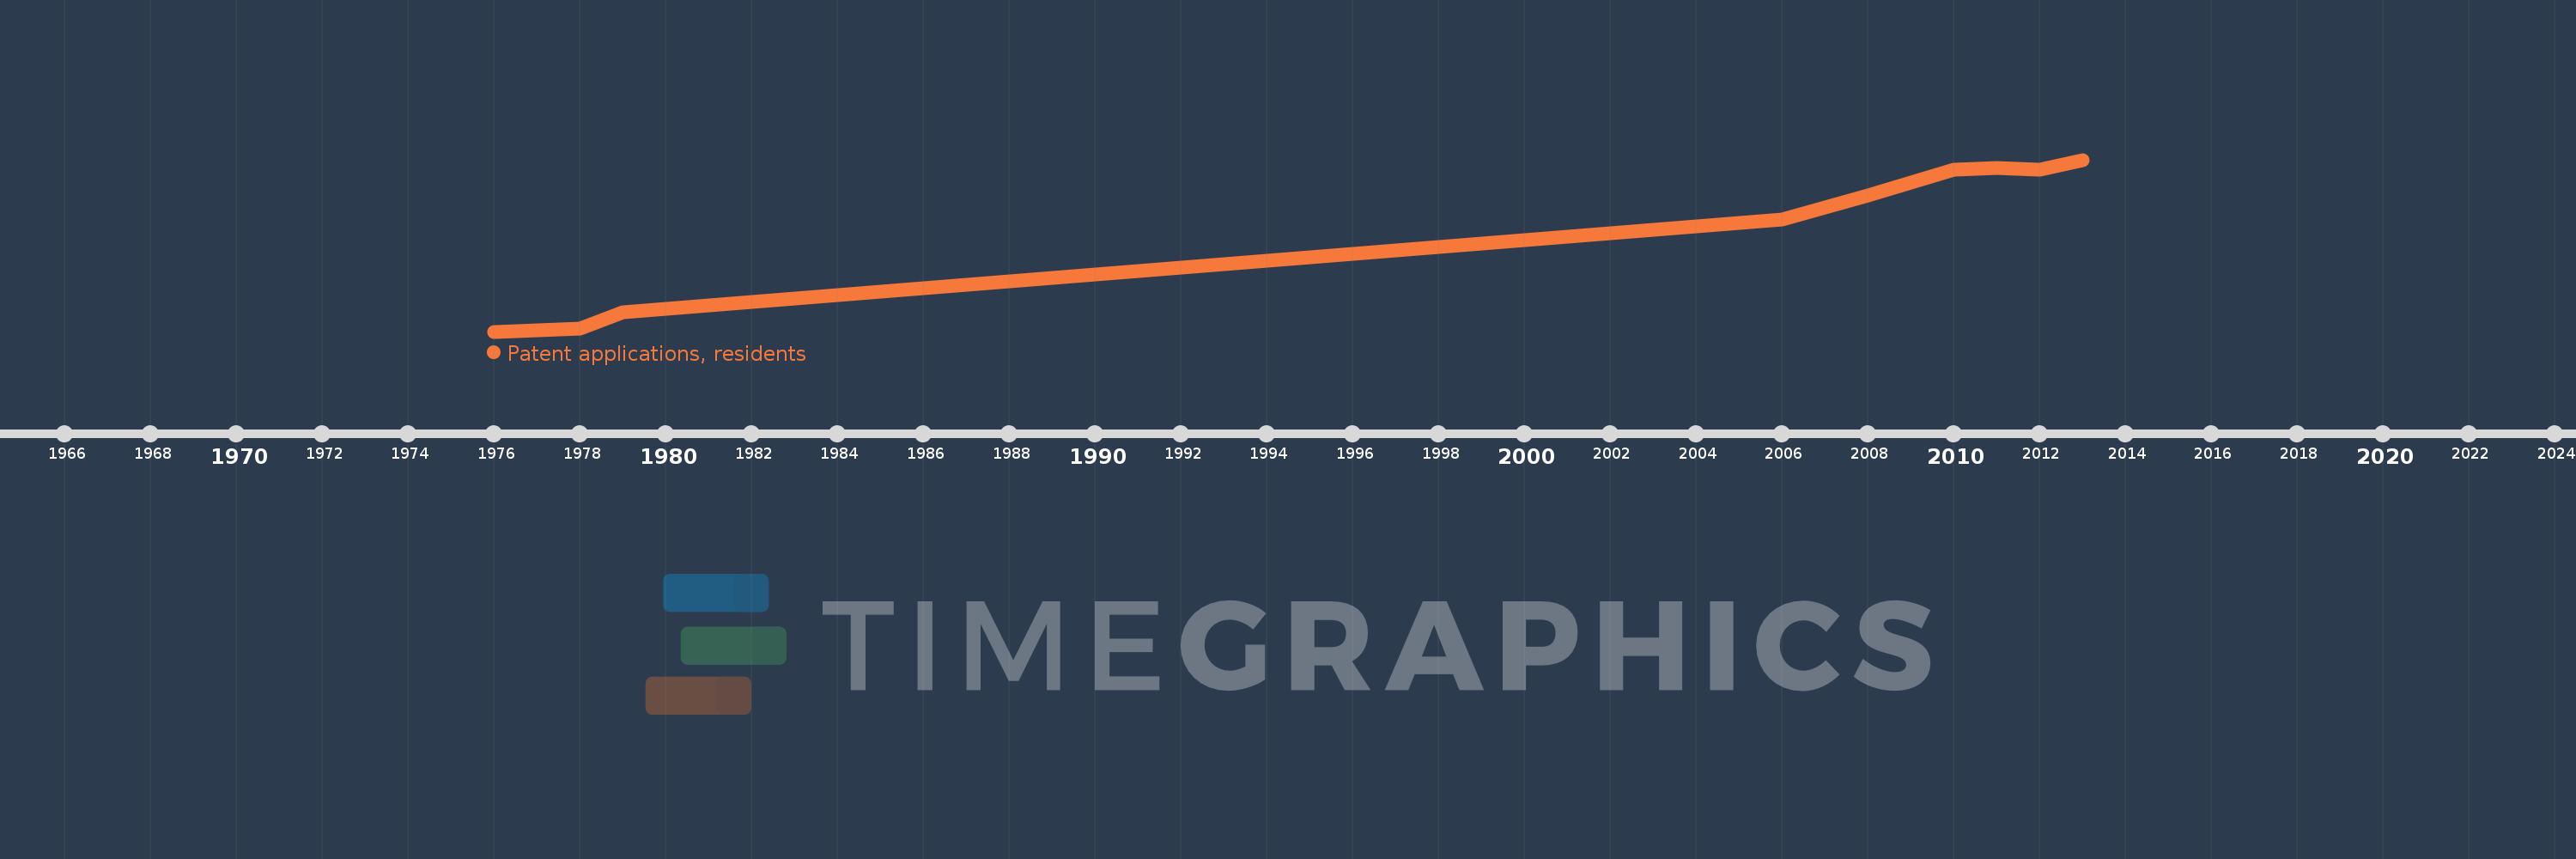
This timeline shows a graph from 1976 to 2013 of Korea, Dem. People’s Rep.. No data until 1975. Number of actual observations by date: 10.
Source name:
World Development Indicators
Source organization:
World Intellectual Property Organization (WIPO), WIPO Patent Report: Statistics on Worldwide Patent Activity. The International Bureau of WIPO assumes no responsibility with respect to the transformation of these data.
Categories, topics:
Science & Technology
Last updated:
apr 23, 2017
Indicators value changes by year
Meaning:
5.577K
Minimum:
1.159K
jan 1, 1976
Maximum:
8.354K
jan 1, 2013
At the date of observation
Value
Absolute change
Change from the previous value
jan 1, 1976
1.159K
+1.159K
0.0%
jan 1, 1978
1.286K
+127.0
10.96%
jan 1, 1979
1.986K
+700.0
54.43%
jan 1, 2006
5.861K
+3.875K
195.12%
jan 1, 2007
6.35K
+489.0
8.34%
jan 1, 2008
6.846K
+496.0
7.81%
jan 1, 2010
7.956K
+1.11K
16.21%
jan 1, 2011
8.018K
+62.0
0.78%
jan 1, 2012
7.956K
-62.0
-0.77%
jan 1, 2013
8.354K
+398.0
5.0%
Ranking of countries by current statistics by years