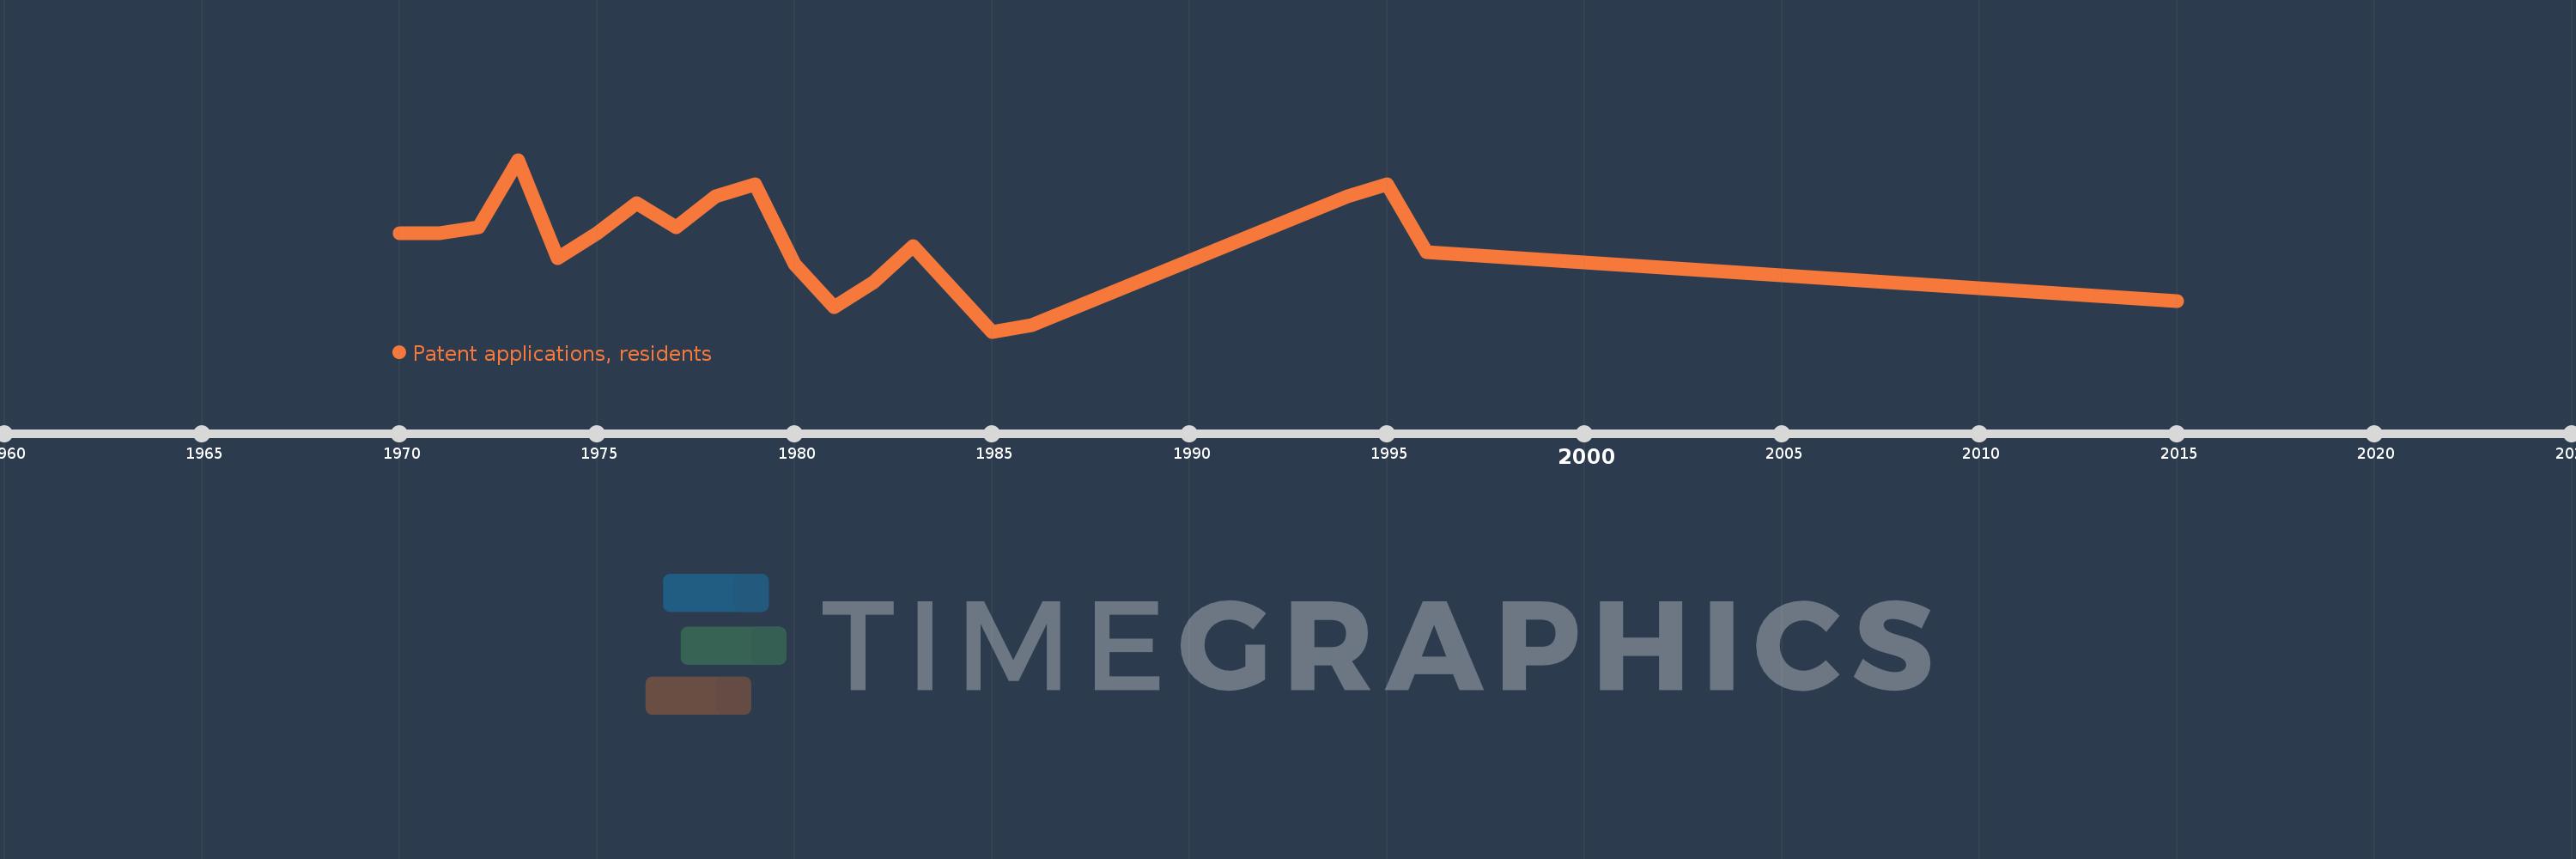
This timeline shows a graph from 1970 to 2015 of Bolivia. No data until 1969. Number of actual observations by date: 21.
Source name:
World Development Indicators
Source organization:
World Intellectual Property Organization (WIPO), WIPO Patent Report: Statistics on Worldwide Patent Activity. The International Bureau of WIPO assumes no responsibility with respect to the transformation of these data.
Categories, topics:
Science & Technology
Last updated:
apr 23, 2017
Indicators value changes by year
Meaning:
18.19
Minimum:
4.0
jan 1, 1985
Maximum:
32.0
jan 1, 1973
At the date of observation
Value
Absolute change
Change from the previous value
jan 1, 1970
20.0
+20.0
0.0%
jan 1, 1971
20.0
0.0
0.0%
jan 1, 1972
21.0
+1.0
5.0%
jan 1, 1973
32.0
+11.0
52.38%
jan 1, 1974
16.0
-16.0
-50.0%
jan 1, 1975
20.0
+4.0
25.0%
jan 1, 1976
25.0
+5.0
25.0%
jan 1, 1977
21.0
-4.0
-16.0%
jan 1, 1978
26.0
+5.0
23.81%
jan 1, 1979
28.0
+2.0
7.69%
jan 1, 1980
15.0
-13.0
-46.43%
jan 1, 1981
8.0
-7.0
-46.67%
jan 1, 1982
12.0
+4.0
50.0%
jan 1, 1983
18.0
+6.0
50.0%
jan 1, 1984
11.0
-7.0
-38.89%
jan 1, 1985
4.0
-7.0
-63.64%
jan 1, 1986
5.0
+1.0
25.0%
jan 1, 1994
26.0
+21.0
420.0%
jan 1, 1995
28.0
+2.0
7.69%
jan 1, 1996
17.0
-11.0
-39.29%
jan 1, 2015
9.0
-8.0
-47.06%
Ranking of countries by current statistics by years