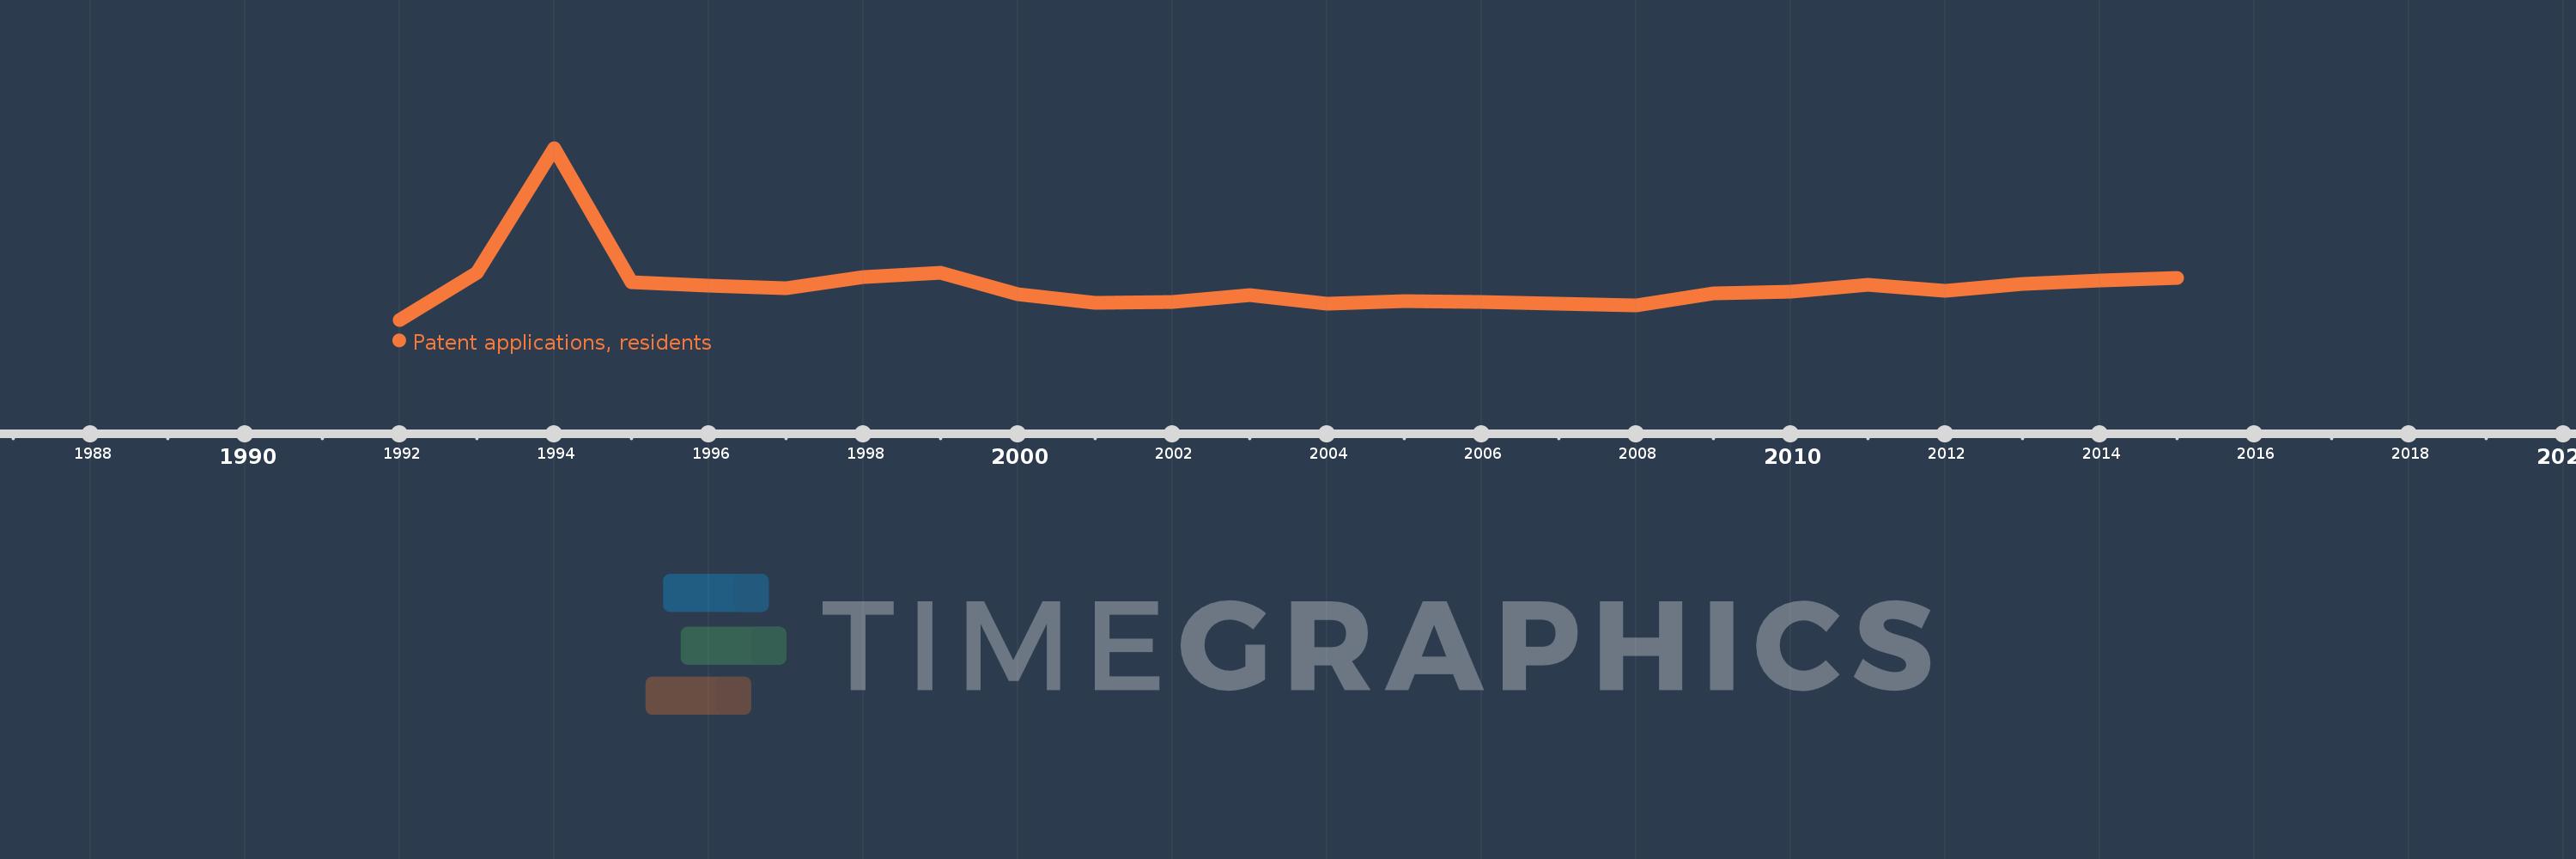
This timeline shows a graph from 1992 to 2015 of Lithuania. No data until 1991. Number of actual observations by date: 24.
Source name:
World Development Indicators
Source organization:
World Intellectual Property Organization (WIPO), WIPO Patent Report: Statistics on Worldwide Patent Activity. The International Bureau of WIPO assumes no responsibility with respect to the transformation of these data.
Categories, topics:
Science & Technology
Last updated:
apr 23, 2017
Indicators value changes by year
Meaning:
104.792
Minimum:
29.0
jan 1, 1992
Maximum:
413.0
jan 1, 1994
At the date of observation
Value
Absolute change
Change from the previous value
jan 1, 1992
29.0
+29.0
0.0%
jan 1, 1993
134.0
+105.0
362.07%
jan 1, 1994
413.0
+279.0
208.21%
jan 1, 1995
112.0
-301.0
-72.88%
jan 1, 1996
106.0
-6.0
-5.36%
jan 1, 1997
100.0
-6.0
-5.66%
jan 1, 1998
125.0
+25.0
25.0%
jan 1, 1999
134.0
+9.0
7.2%
jan 1, 2000
86.0
-48.0
-35.82%
jan 1, 2001
66.0
-20.0
-23.26%
jan 1, 2002
68.0
+2.0
3.03%
jan 1, 2003
85.0
+17.0
25.0%
jan 1, 2004
64.0
-21.0
-24.71%
jan 1, 2005
70.0
+6.0
9.38%
jan 1, 2006
68.0
-2.0
-2.86%
jan 1, 2007
65.0
-3.0
-4.41%
jan 1, 2008
62.0
-3.0
-4.62%
jan 1, 2009
87.0
+25.0
40.32%
jan 1, 2010
91.0
+4.0
4.6%
jan 1, 2011
108.0
+17.0
18.68%
jan 1, 2012
93.0
-15.0
-13.89%
jan 1, 2013
109.0
+16.0
17.2%
jan 1, 2014
117.0
+8.0
7.34%
jan 1, 2015
123.0
+6.0
5.13%
Ranking of countries by current statistics by years