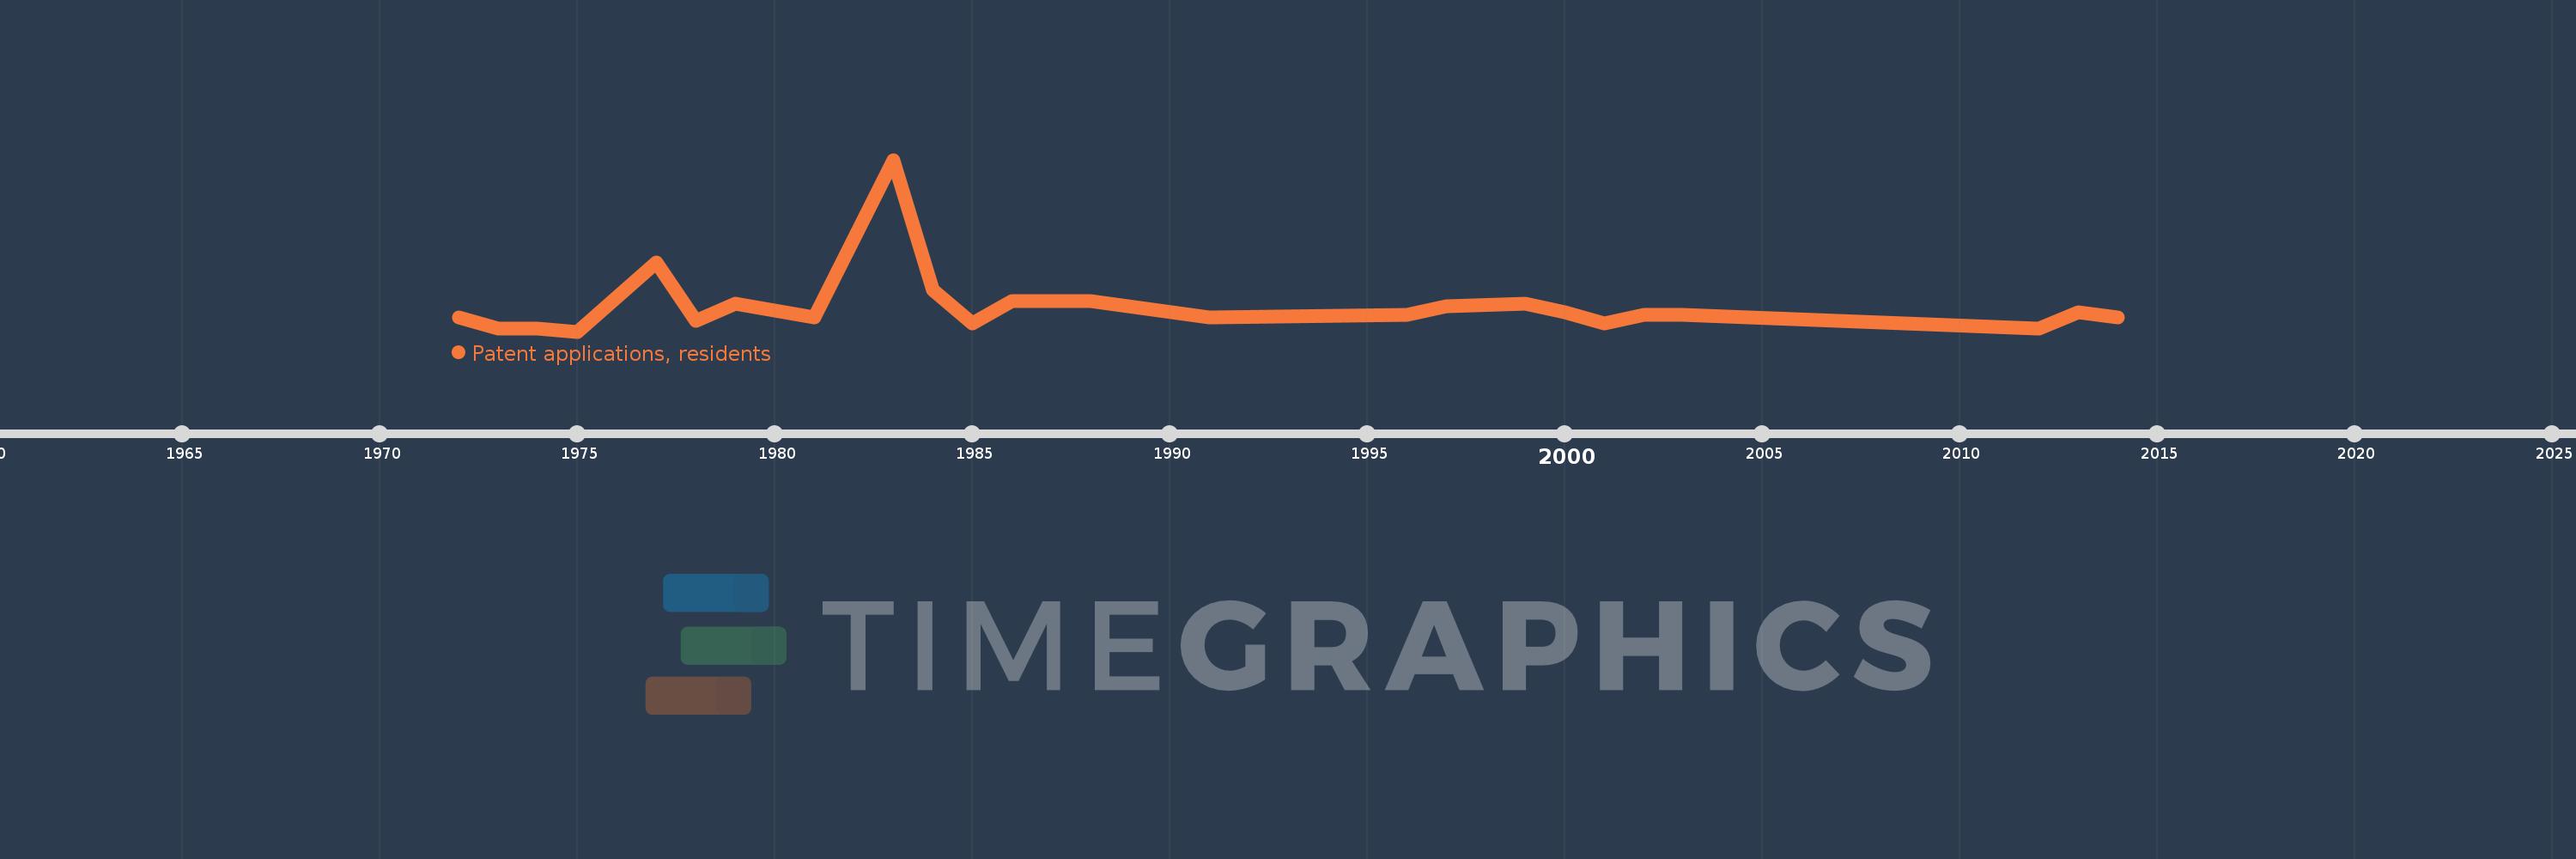
This timeline shows a graph from 1972 to 2014 of Honduras. No data until 1971. Number of actual observations by date: 24.
Source name:
World Development Indicators
Source organization:
World Intellectual Property Organization (WIPO), WIPO Patent Report: Statistics on Worldwide Patent Activity. The International Bureau of WIPO assumes no responsibility with respect to the transformation of these data.
Categories, topics:
Science & Technology
Last updated:
apr 23, 2017
Indicators value changes by year
Meaning:
10.083
Minimum:
1.0
jan 1, 1975
Maximum:
63.0
jan 1, 1983
At the date of observation
Value
Absolute change
Change from the previous value
jan 1, 1972
6.0
+6.0
0.0%
jan 1, 1973
2.0
-4.0
-66.67%
jan 1, 1974
2.0
0.0
0.0%
jan 1, 1975
1.0
-1.0
-50.0%
jan 1, 1977
26.0
+25.0
2.5K%
jan 1, 1978
5.0
-21.0
-80.77%
jan 1, 1979
11.0
+6.0
120.0%
jan 1, 1981
6.0
-5.0
-45.45%
jan 1, 1983
63.0
+57.0
950.0%
jan 1, 1984
16.0
-47.0
-74.6%
jan 1, 1985
4.0
-12.0
-75.0%
jan 1, 1986
12.0
+8.0
200.0%
jan 1, 1988
12.0
0.0
0.0%
jan 1, 1991
6.0
-6.0
-50.0%
jan 1, 1996
7.0
+1.0
16.67%
jan 1, 1997
10.0
+3.0
42.86%
jan 1, 1999
11.0
+1.0
10.0%
jan 1, 2000
8.0
-3.0
-27.27%
jan 1, 2001
4.0
-4.0
-50.0%
jan 1, 2002
7.0
+3.0
75.0%
jan 1, 2003
7.0
0.0
0.0%
jan 1, 2012
2.0
-5.0
-71.43%
jan 1, 2013
8.0
+6.0
300.0%
jan 1, 2014
6.0
-2.0
-25.0%
Ranking of countries by current statistics by years