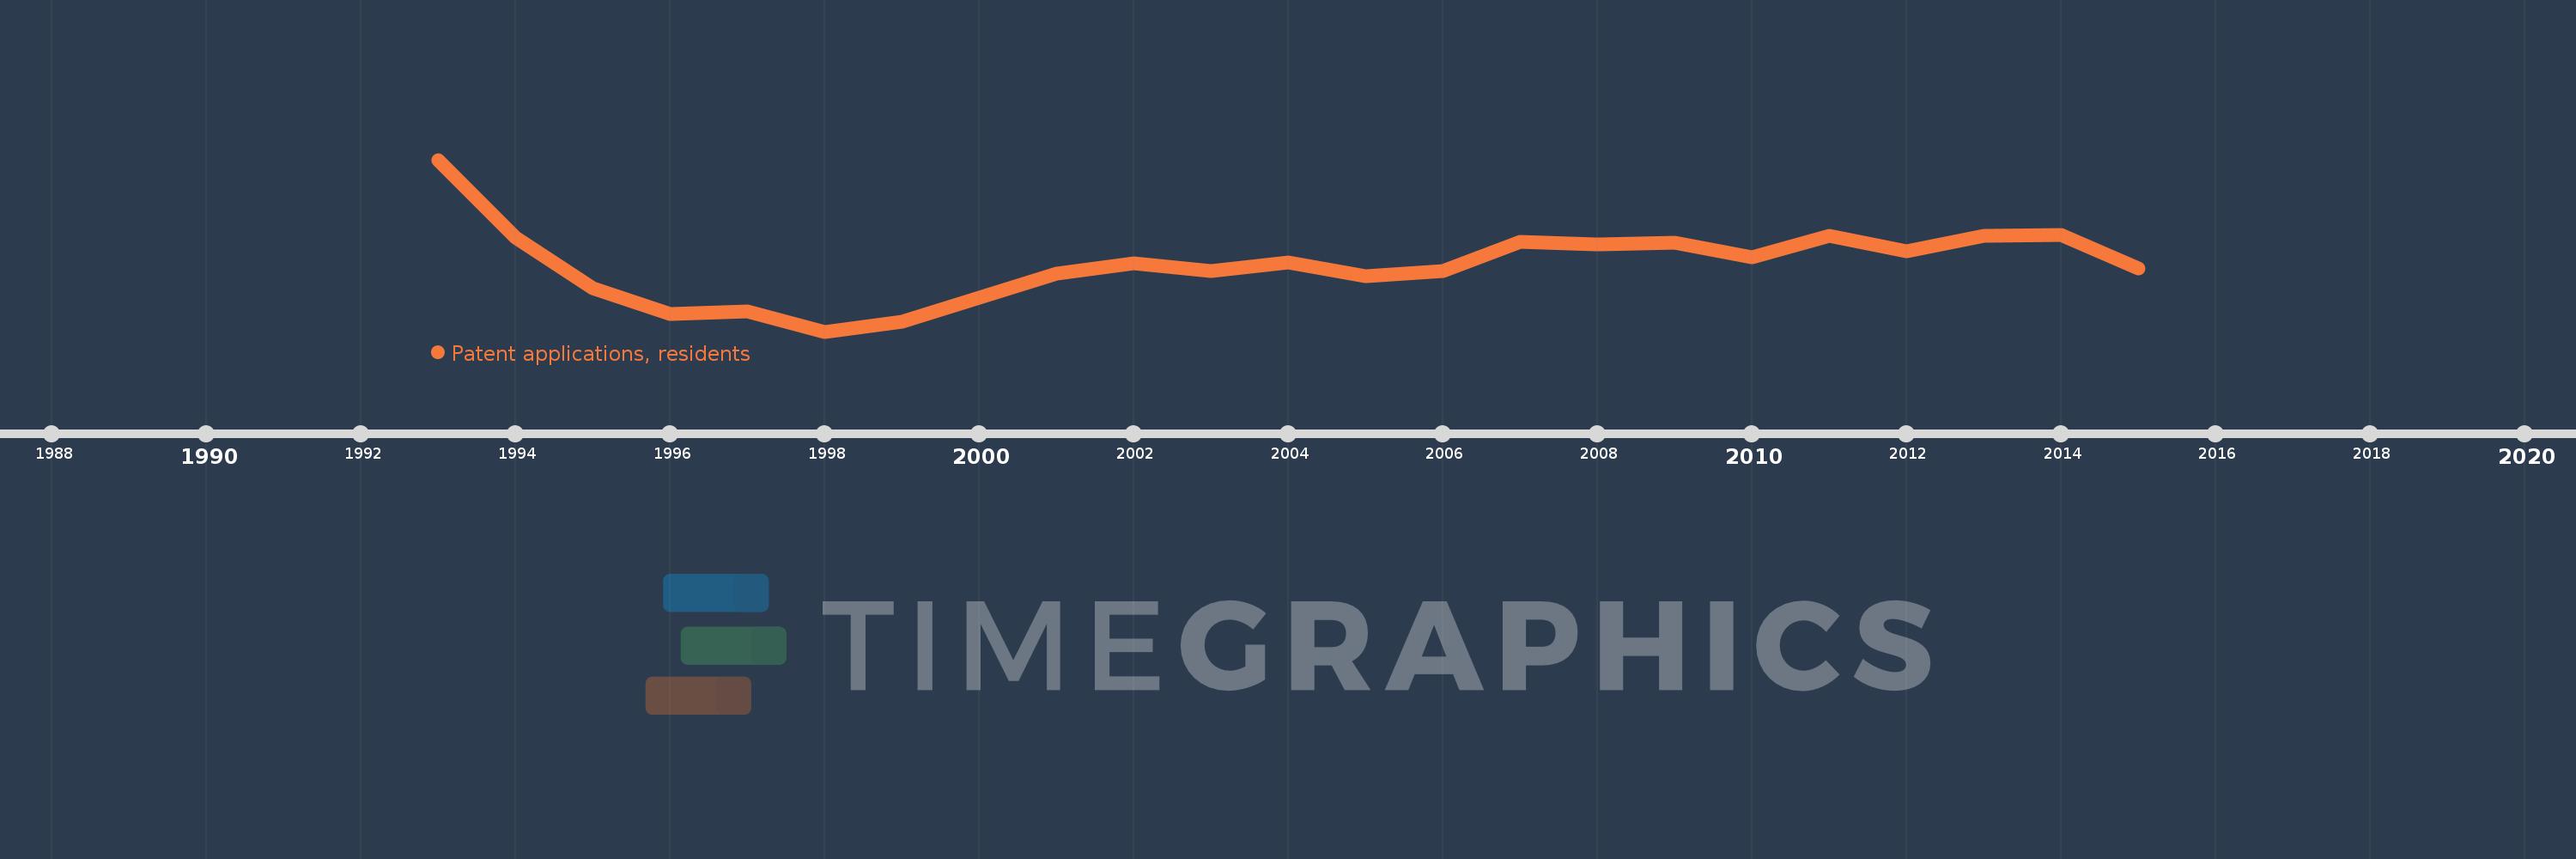
This timeline shows a graph from 1993 to 2015 of Russian Federation. No data until 1992. Number of actual observations by date: 23.
Source name:
World Development Indicators
Source organization:
World Intellectual Property Organization (WIPO), WIPO Patent Report: Statistics on Worldwide Patent Activity. The International Bureau of WIPO assumes no responsibility with respect to the transformation of these data.
Categories, topics:
Science & Technology
Last updated:
apr 23, 2017
Indicators value changes by year
Meaning:
24.573K
Minimum:
15.106K
jan 1, 1998
Maximum:
39.494K
jan 1, 1993
At the date of observation
Value
Absolute change
Change from the previous value
jan 1, 1993
39.494K
+39.494K
0.0%
jan 1, 1994
28.503K
-10.991K
-27.83%
jan 1, 1995
21.25K
-7.253K
-25.45%
jan 1, 1996
17.551K
-3.699K
-17.41%
jan 1, 1997
18.014K
+463.0
2.64%
jan 1, 1998
15.106K
-2.908K
-16.14%
jan 1, 1999
16.454K
+1.348K
8.92%
jan 1, 2000
19.9K
+3.446K
20.94%
jan 1, 2001
23.377K
+3.477K
17.47%
jan 1, 2002
24.777K
+1.4K
5.99%
jan 1, 2003
23.712K
-1.065K
-4.3%
jan 1, 2004
24.969K
+1.257K
5.3%
jan 1, 2005
22.985K
-1.984K
-7.95%
jan 1, 2006
23.644K
+659.0
2.87%
jan 1, 2007
27.884K
+4.24K
17.93%
jan 1, 2008
27.505K
-379.0
-1.36%
jan 1, 2009
27.712K
+207.0
0.75%
jan 1, 2010
25.598K
-2.114K
-7.63%
jan 1, 2011
28.722K
+3.124K
12.2%
jan 1, 2012
26.495K
-2.227K
-7.75%
jan 1, 2013
28.701K
+2.206K
8.33%
jan 1, 2014
28.765K
+64.0
0.22%
jan 1, 2015
24.072K
-4.693K
-16.31%
Ranking of countries by current statistics by years