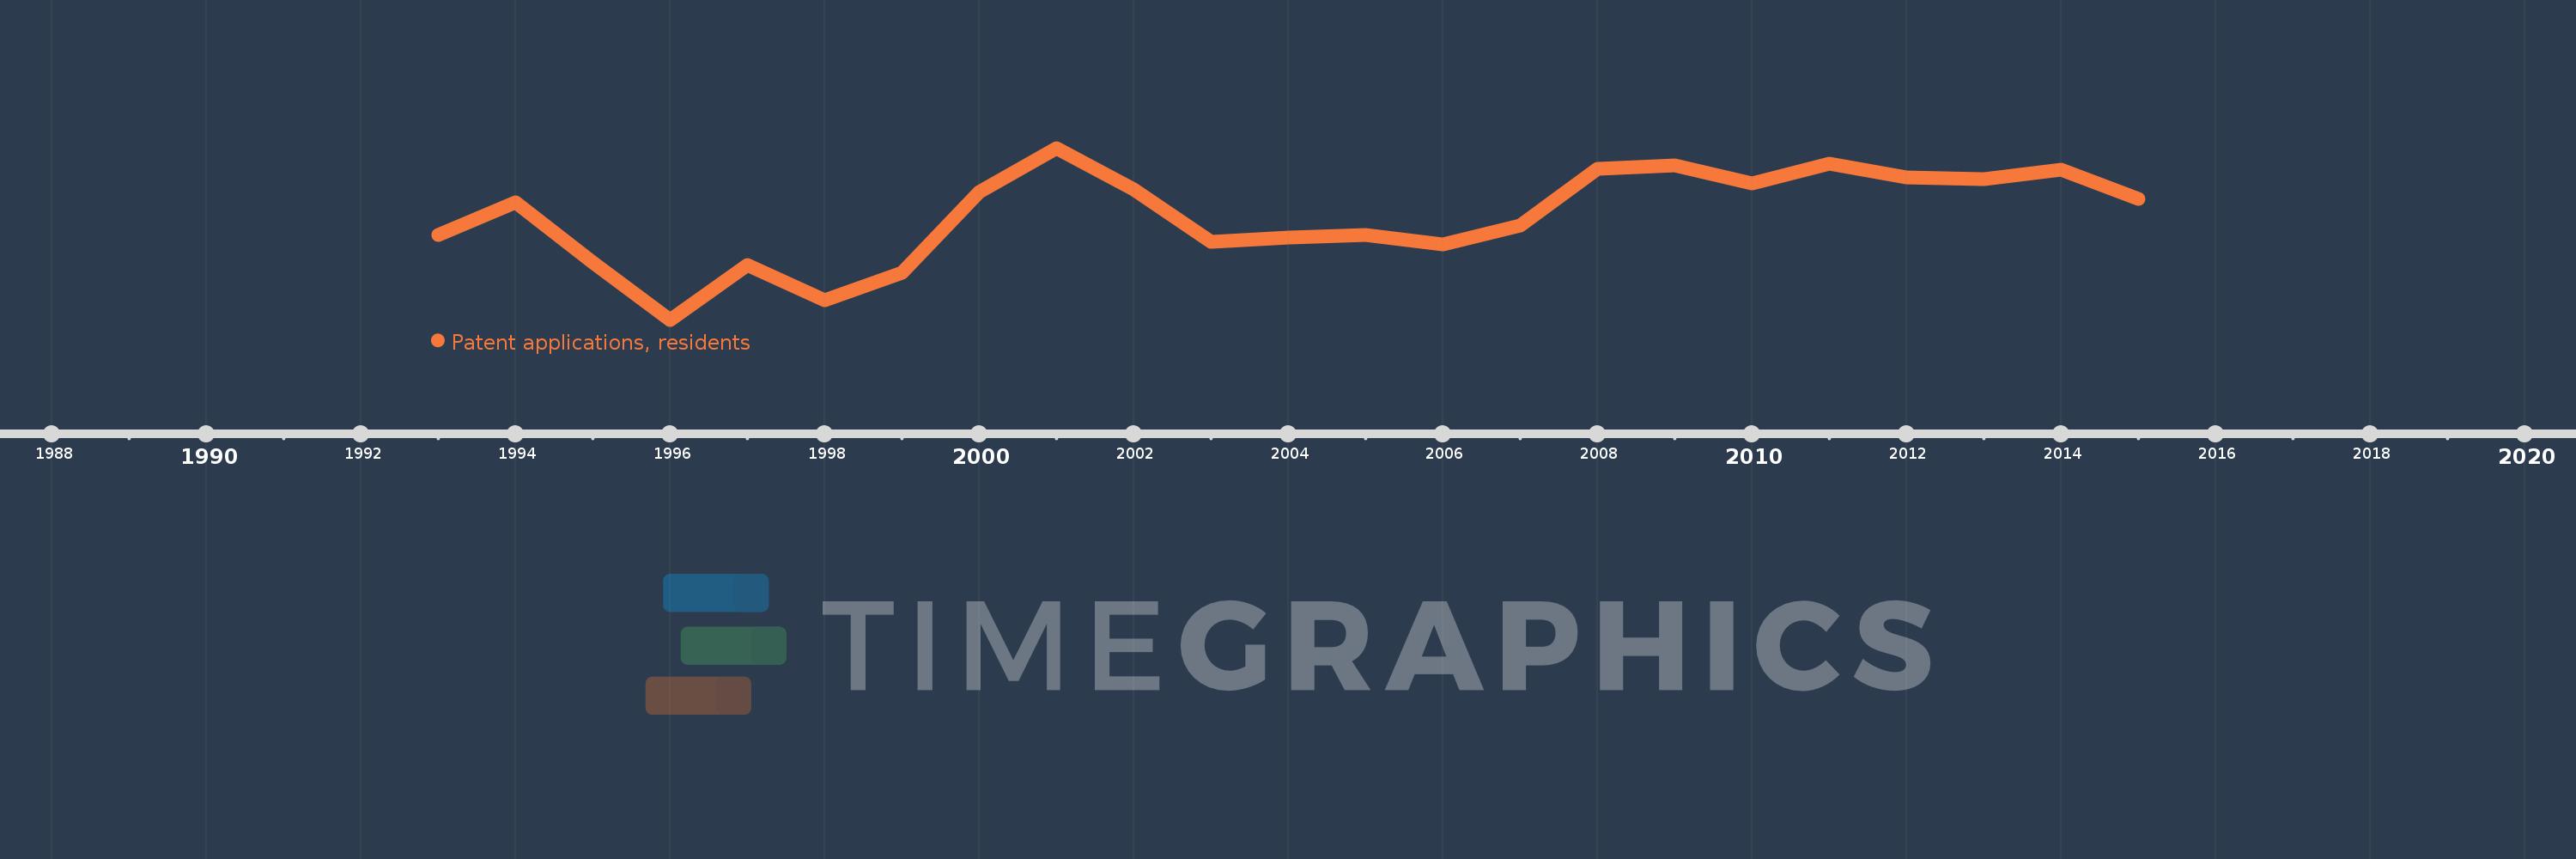
This timeline shows a graph from 1993 to 2015 of Europe & Central Asia. No data until 1992. Number of actual observations by date: 23.
Source name:
World Development Indicators
Source organization:
World Intellectual Property Organization (WIPO), WIPO Patent Report: Statistics on Worldwide Patent Activity. The International Bureau of WIPO assumes no responsibility with respect to the transformation of these data.
Categories, topics:
Science & Technology
Last updated:
apr 23, 2017
Indicators value changes by year
Meaning:
142.561K
Minimum:
122.401K
jan 1, 1996
Maximum:
155.927K
jan 1, 2001
At the date of observation
Value
Absolute change
Change from the previous value
jan 1, 1993
138.969K
+138.969K
0.0%
jan 1, 1994
145.365K
+6.396K
4.6%
jan 1, 1995
133.569K
-11.796K
-8.11%
jan 1, 1996
122.401K
-11.168K
-8.36%
jan 1, 1997
133.026K
+10.625K
8.68%
jan 1, 1998
126.206K
-6.82K
-5.13%
jan 1, 1999
131.491K
+5.285K
4.19%
jan 1, 2000
147.25K
+15.759K
11.98%
jan 1, 2001
155.927K
+8.677K
5.89%
jan 1, 2002
147.866K
-8.061K
-5.17%
jan 1, 2003
137.63K
-10.236K
-6.92%
jan 1, 2004
138.508K
+878.0
0.64%
jan 1, 2005
138.975K
+467.0
0.34%
jan 1, 2006
137.103K
-1.872K
-1.35%
jan 1, 2007
140.824K
+3.721K
2.71%
jan 1, 2008
151.829K
+11.005K
7.81%
jan 1, 2009
152.574K
+745.0
0.49%
jan 1, 2010
148.934K
-3.64K
-2.39%
jan 1, 2011
152.872K
+3.938K
2.64%
jan 1, 2012
150.13K
-2.742K
-1.79%
jan 1, 2013
149.813K
-317.0
-0.21%
jan 1, 2014
151.658K
+1.845K
1.23%
jan 1, 2015
145.986K
-5.672K
-3.74%
Ranking of countries by current statistics by years