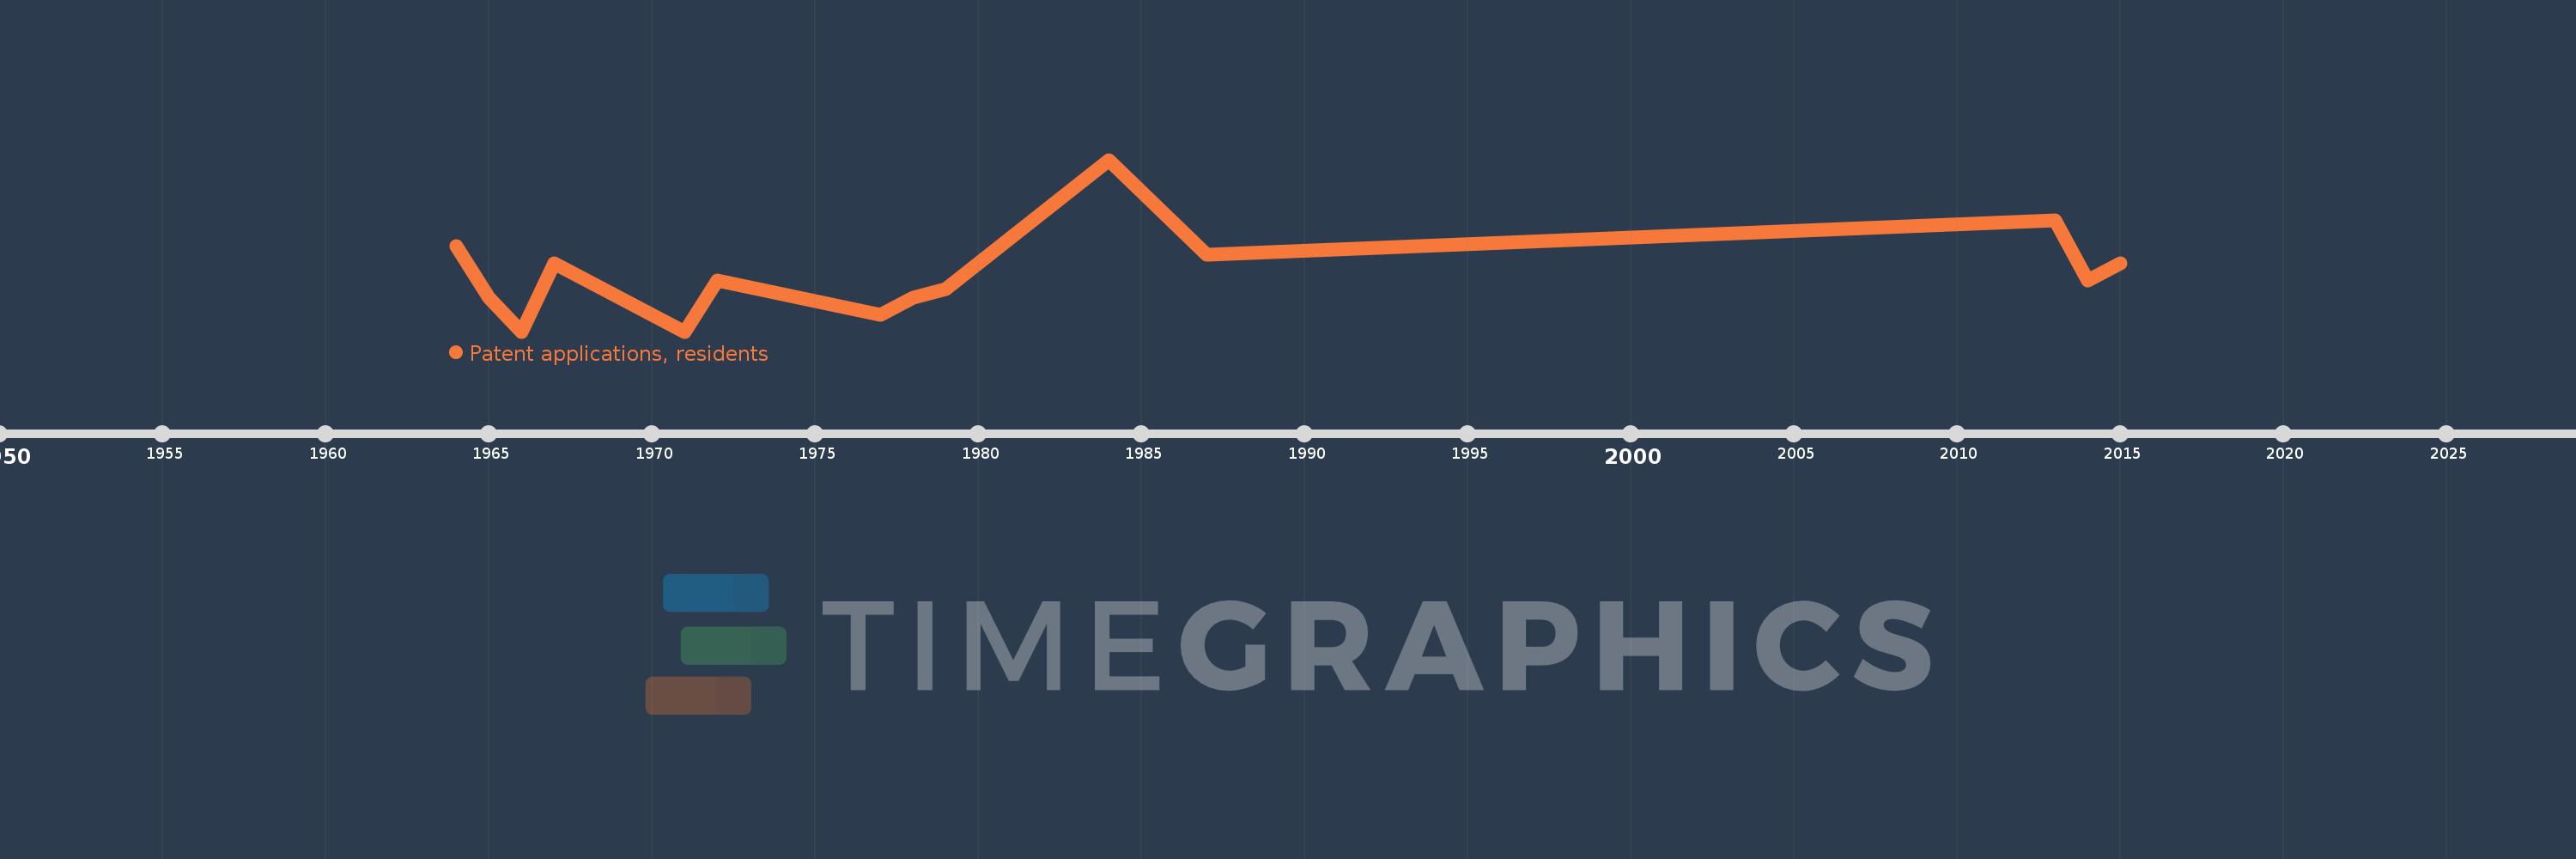
This timeline shows a graph from 1964 to 2015 of Dominican Republic. No data until 1963. Number of actual observations by date: 14.
Source name:
World Development Indicators
Source organization:
World Intellectual Property Organization (WIPO), WIPO Patent Report: Statistics on Worldwide Patent Activity. The International Bureau of WIPO assumes no responsibility with respect to the transformation of these data.
Categories, topics:
Science & Technology
Last updated:
apr 23, 2017
Indicators value changes by year
Meaning:
11.786
Minimum:
5.0
jan 1, 1966
Maximum:
25.0
jan 1, 1984
At the date of observation
Value
Absolute change
Change from the previous value
jan 1, 1964
15.0
+15.0
0.0%
jan 1, 1965
9.0
-6.0
-40.0%
jan 1, 1966
5.0
-4.0
-44.44%
jan 1, 1967
13.0
+8.0
160.0%
jan 1, 1971
5.0
-8.0
-61.54%
jan 1, 1972
11.0
+6.0
120.0%
jan 1, 1977
7.0
-4.0
-36.36%
jan 1, 1978
9.0
+2.0
28.57%
jan 1, 1979
10.0
+1.0
11.11%
jan 1, 1984
25.0
+15.0
150.0%
jan 1, 1987
14.0
-11.0
-44.0%
jan 1, 2013
18.0
+4.0
28.57%
jan 1, 2014
11.0
-7.0
-38.89%
jan 1, 2015
13.0
+2.0
18.18%
Ranking of countries by current statistics by years