29
/
en
AIzaSyAYiBZKx7MnpbEhh9jyipgxe19OcubqV5w
April 1, 2024
96037
Burundi
BDI
true
2
1
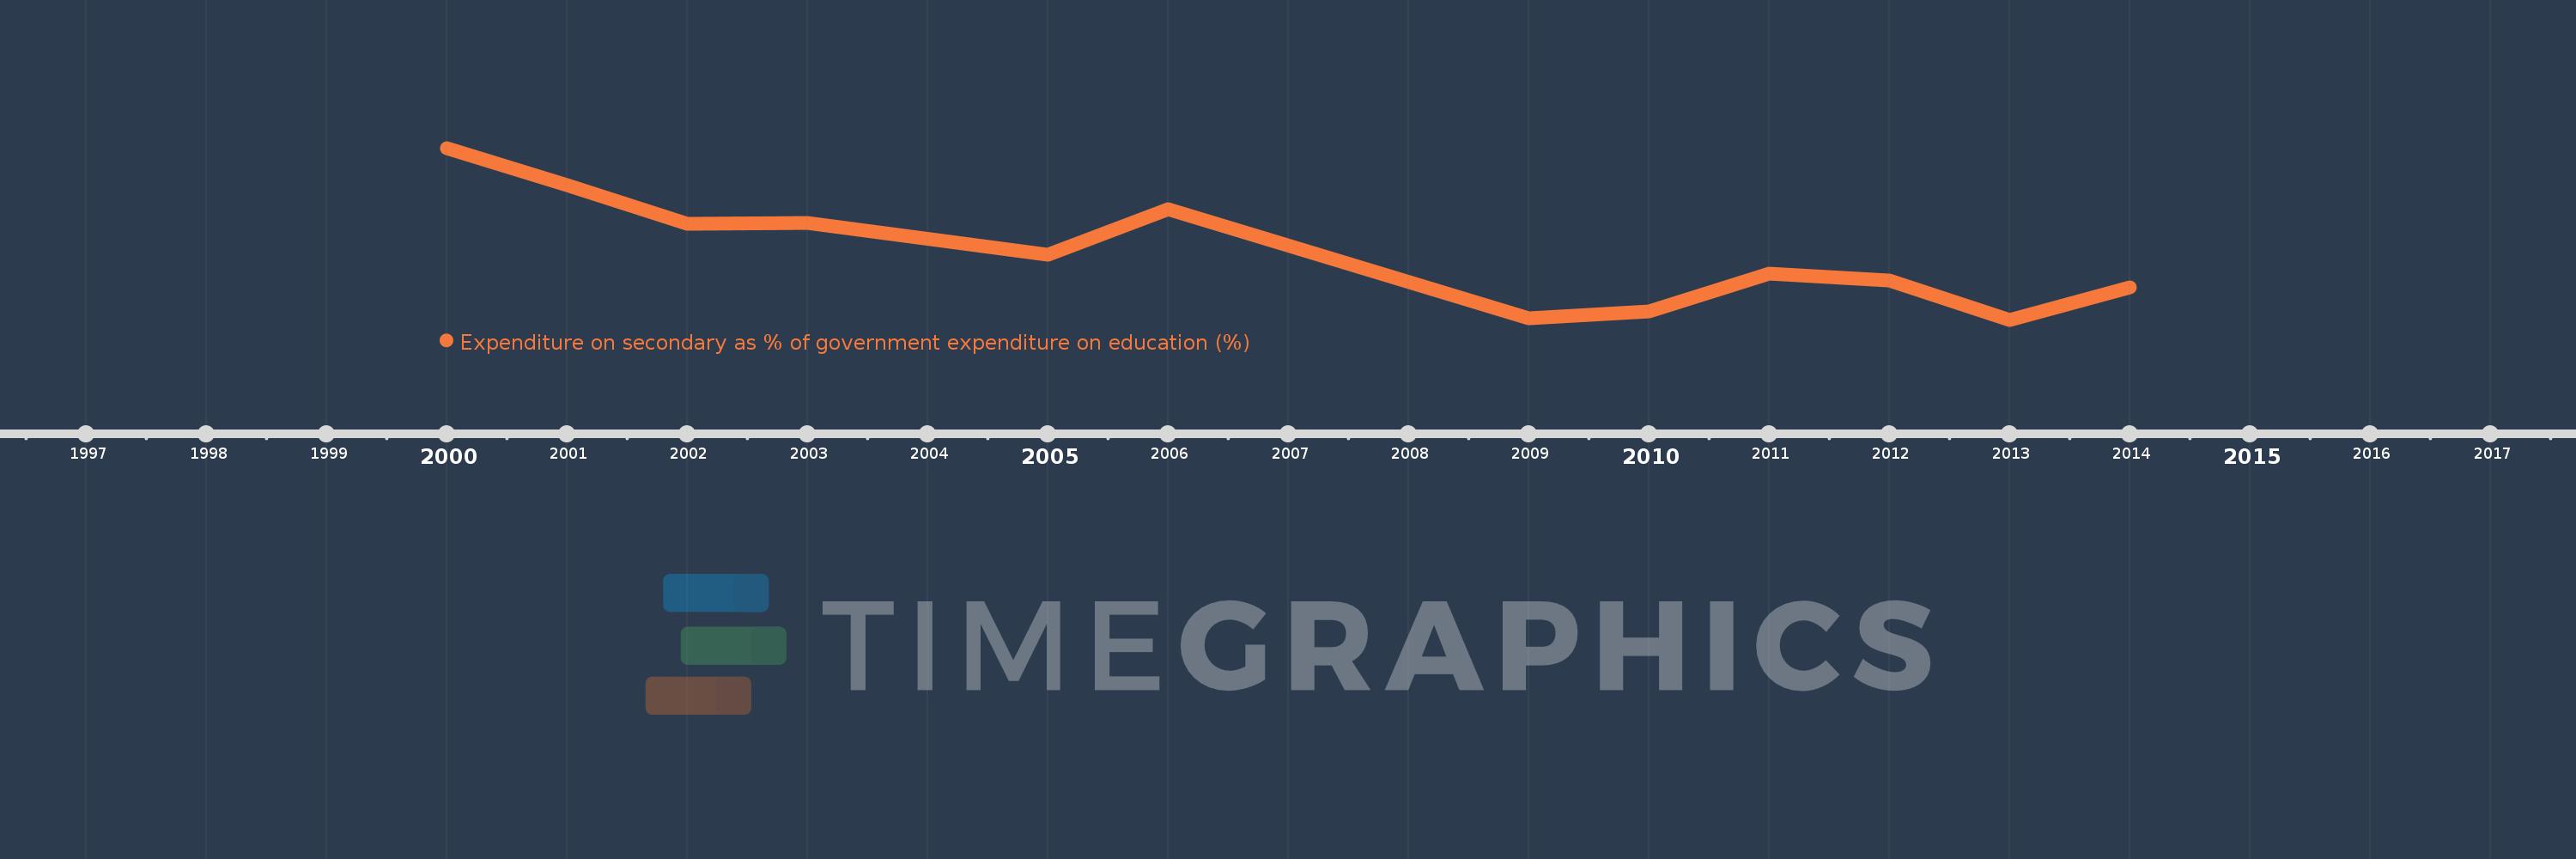
Expenditure on secondary as % of government expenditure on education (%)
2014,2013,2012,2011,2010,2009,2006,2005,2003,2002,2001,2000
This statistics in other country:
Timeline:
This timeline shows a graph from 2000 to 2014 of Burundi. No data until 1999. Number of actual observations by date: 12.
Source name:
World Development Indicators
Source organization:
UNESCO Institute for Statistics
Categories, topics:
Education
Last updated:
apr 23, 2017
Indicators value changes by year
Minimum:
24.216
jan 1, 2013
Maximum:
37.998
jan 1, 2000
At the date of observation
Value
Absolute change
Change from previous value
jan 1, 2000
37.998
+37.998
0.0%
jan 1, 2001
35.037
-2.96
-7.79%
jan 1, 2002
31.908
-3.129
-8.93%
jan 1, 2003
31.98
+0.072
0.22%
jan 1, 2005
29.453
-2.527
-7.9%
jan 1, 2006
33.11
+3.657
12.42%
jan 1, 2009
24.362
-8.748
-26.42%
jan 1, 2010
24.893
+0.531
2.18%
jan 1, 2011
27.917
+3.024
12.15%
jan 1, 2012
27.356
-0.561
-2.01%
jan 1, 2013
24.216
-3.14
-11.48%
jan 1, 2014
26.817
+2.601
10.74%
Ranking of countries by current statistics by years


Comments: