29
/
en
AIzaSyAYiBZKx7MnpbEhh9jyipgxe19OcubqV5w
April 1, 2024
271137
Turks and Caicos Islands
TCA
true
2
1
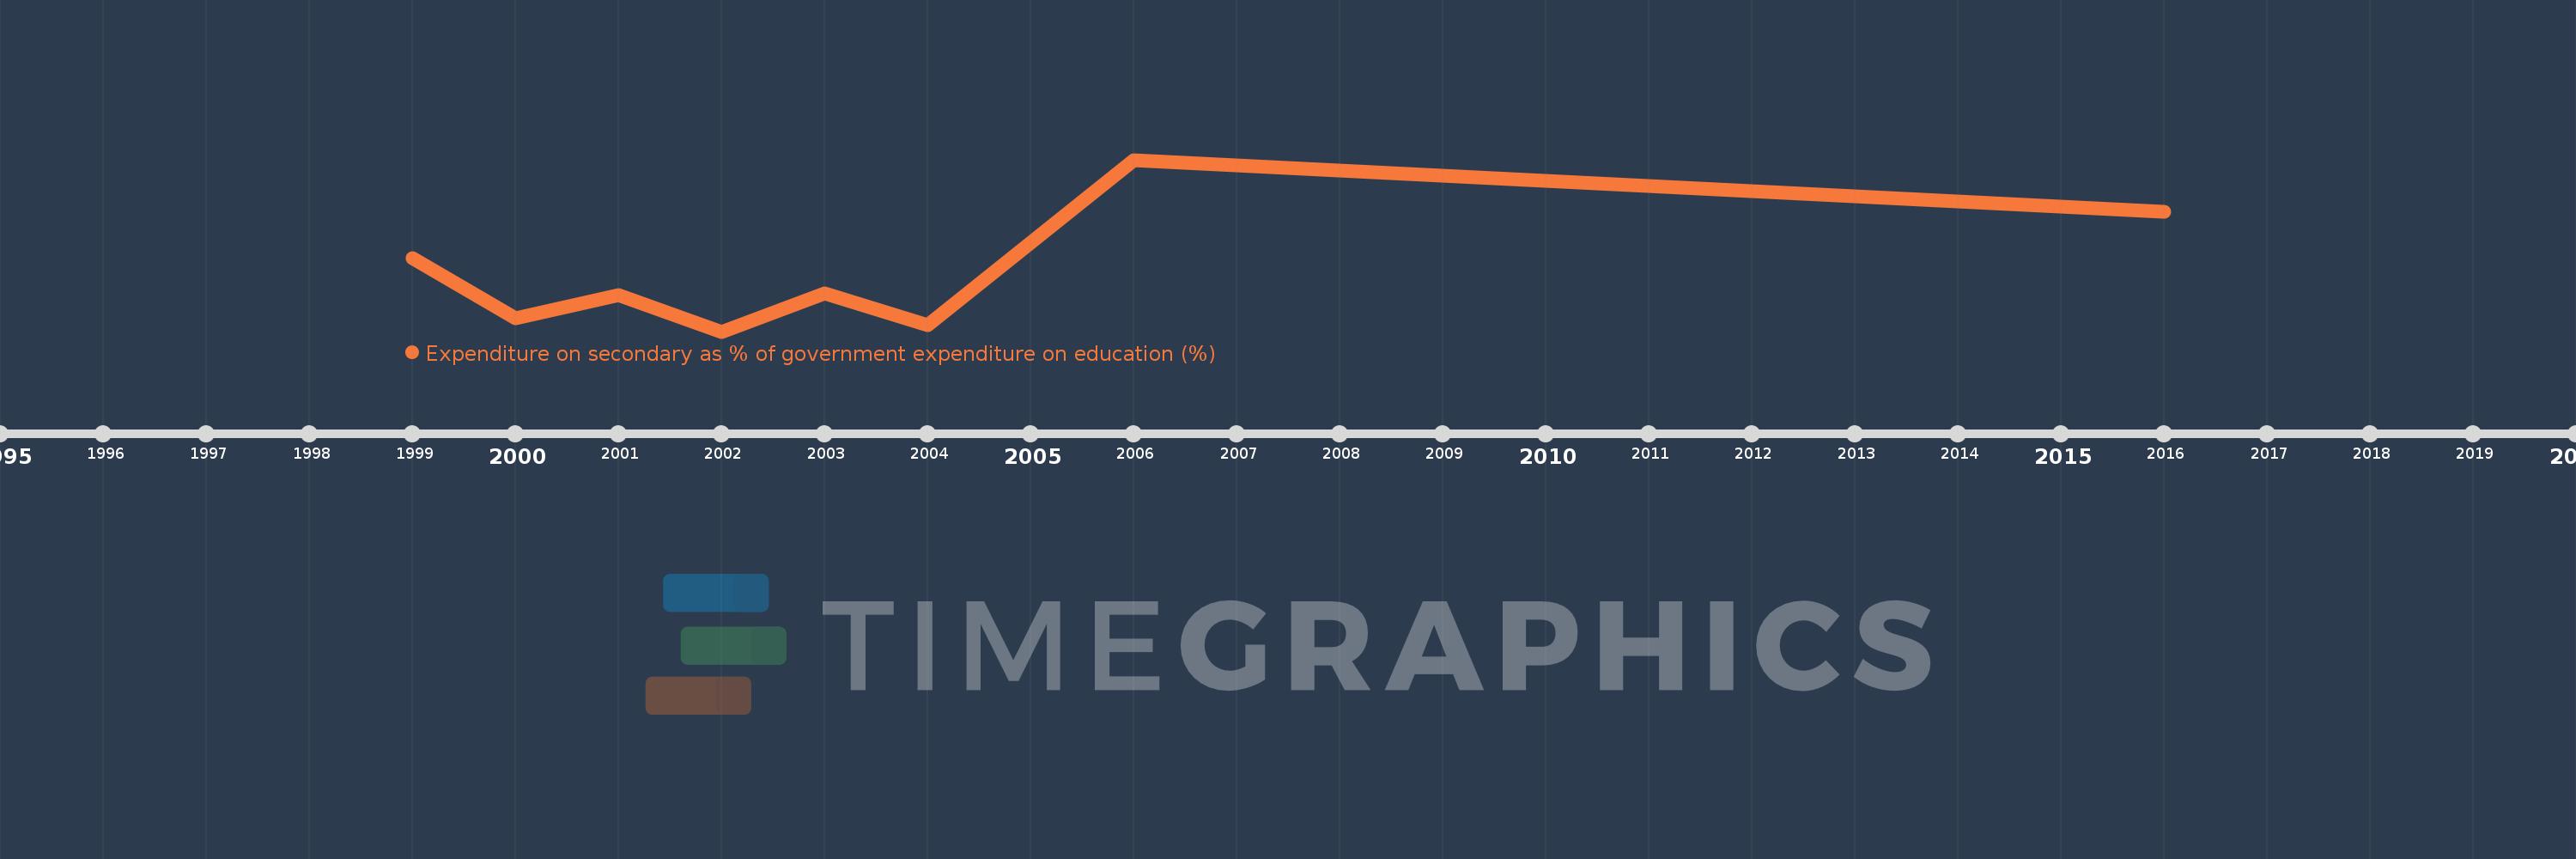
Expenditure on secondary as % of government expenditure on education (%)
2016,2006,2004,2003,2002,2001,2000,1999
This statistics in other country:
Timeline:
This timeline shows a graph from 1999 to 2016 of Turks and Caicos Islands. No data until 1998. Number of actual observations by date: 8.
Source name:
World Development Indicators
Source organization:
UNESCO Institute for Statistics
Categories, topics:
Education
Last updated:
apr 23, 2017
Indicators value changes by year
Minimum:
27.244
jan 1, 2002
Maximum:
47.651
jan 1, 2006
At the date of observation
Value
Absolute change
Change from previous value
jan 1, 1999
35.929
+35.929
0.0%
jan 1, 2000
28.78
-7.149
-19.9%
jan 1, 2001
31.539
+2.759
9.59%
jan 1, 2002
27.244
-4.295
-13.62%
jan 1, 2003
31.75
+4.506
16.54%
jan 1, 2004
27.968
-3.782
-11.91%
jan 1, 2006
47.651
+19.683
70.38%
jan 1, 2016
41.473
-6.178
-12.96%
Ranking of countries by current statistics by years


Comments: