29
/
en
AIzaSyAYiBZKx7MnpbEhh9jyipgxe19OcubqV5w
April 1, 2024
275627
United Kingdom
GBR
true
2
1
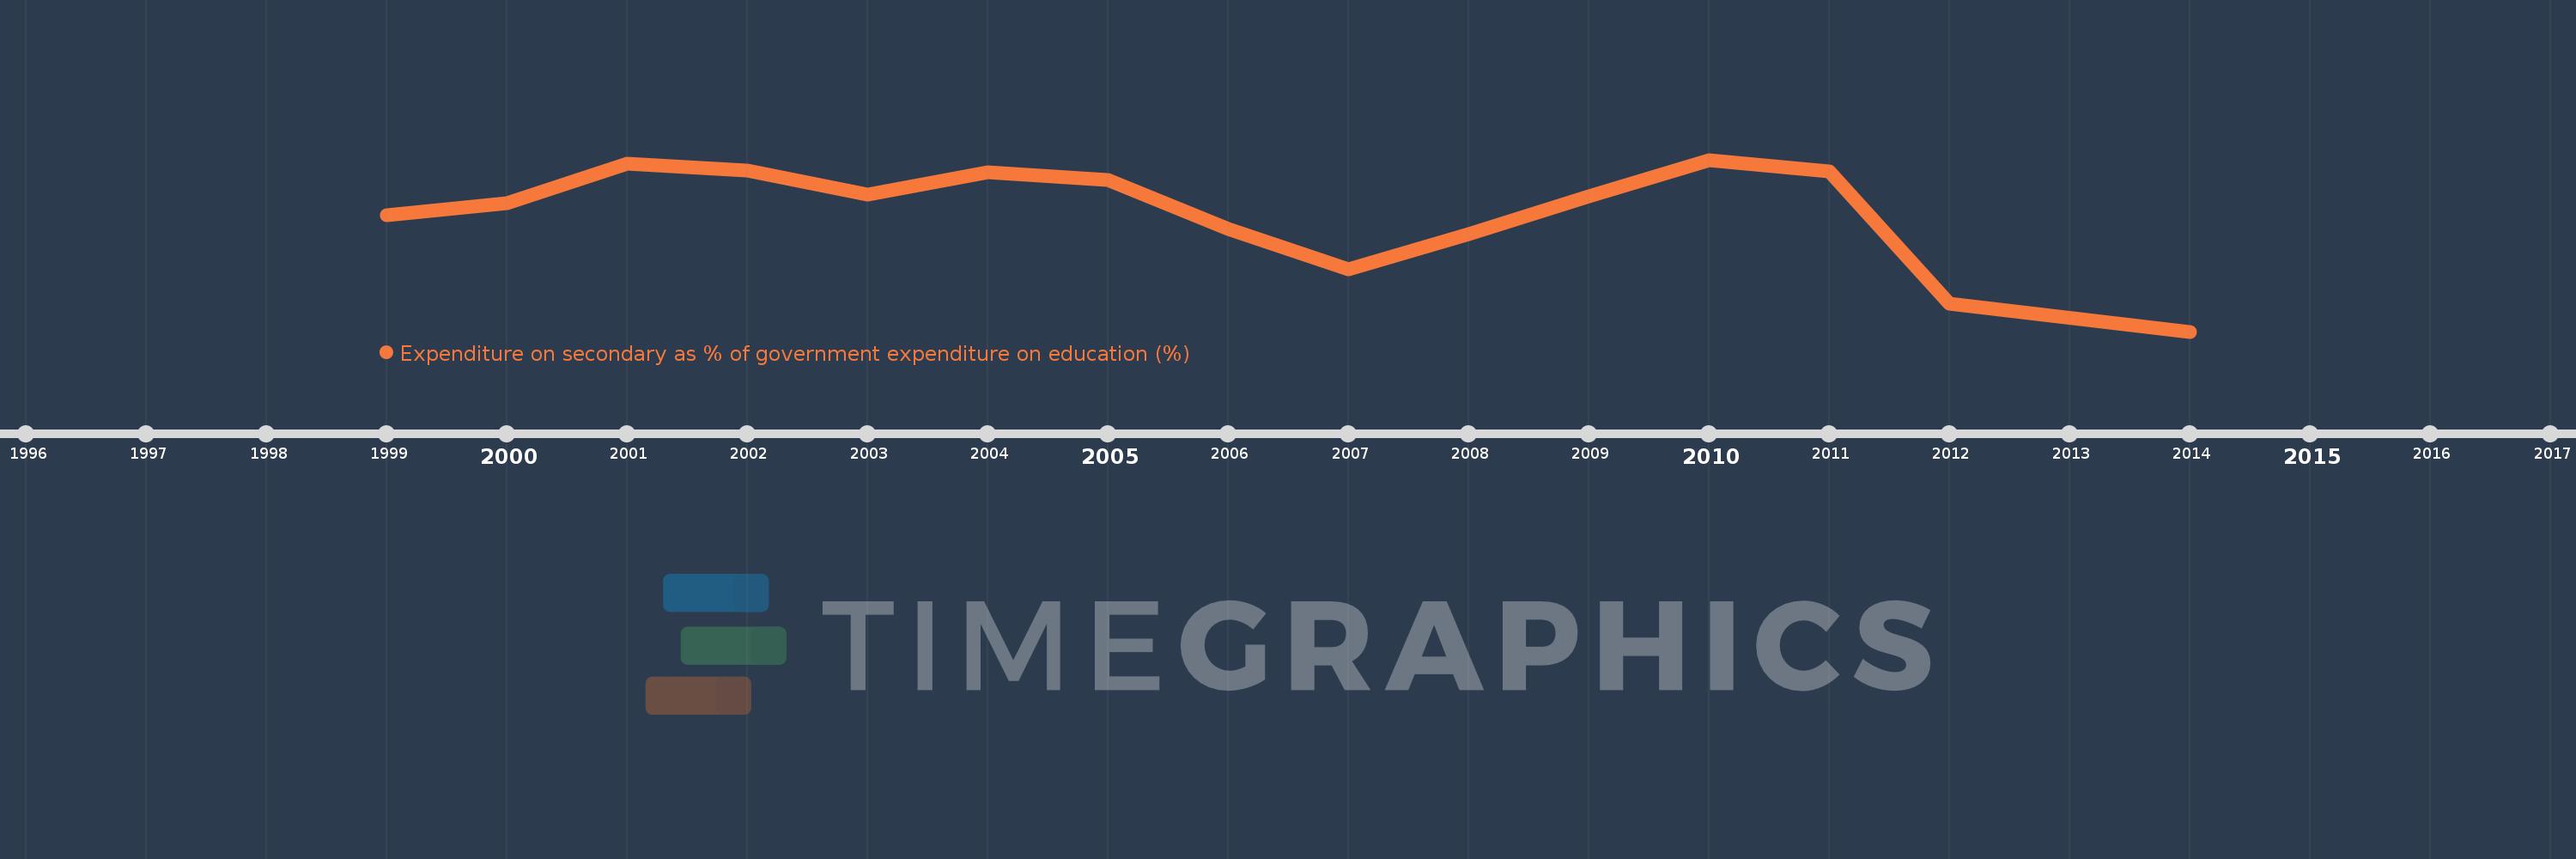
Expenditure on secondary as % of government expenditure on education (%)
2014,2012,2011,2010,2009,2008,2007,2006,2005,2004,2003,2002,2001,2000,1999
This statistics in other country:
Timeline:
This timeline shows a graph from 1999 to 2014 of United Kingdom. No data until 1998. Number of actual observations by date: 15.
Source name:
World Development Indicators
Source organization:
UNESCO Institute for Statistics
Categories, topics:
Education
Last updated:
apr 23, 2017
Indicators value changes by year
Minimum:
40.139
jan 1, 2014
At the date of observation
Value
Absolute change
Change from previous value
jan 1, 1999
46.076
+46.076
0.0%
jan 1, 2000
46.708
+0.632
1.37%
jan 1, 2001
48.733
+2.026
4.34%
jan 1, 2002
48.356
-0.377
-0.77%
jan 1, 2003
47.148
-1.208
-2.5%
jan 1, 2004
48.274
+1.126
2.39%
jan 1, 2005
47.882
-0.392
-0.81%
jan 1, 2006
45.389
-2.493
-5.21%
jan 1, 2007
43.314
-2.074
-4.57%
jan 1, 2008
45.109
+1.794
4.14%
jan 1, 2009
47.039
+1.931
4.28%
jan 1, 2010
48.92
+1.88
4.0%
jan 1, 2011
48.318
-0.602
-1.23%
jan 1, 2012
41.571
-6.747
-13.96%
jan 1, 2014
40.139
-1.432
-3.44%
Ranking of countries by current statistics by years


Comments: