29
/
en
AIzaSyAYiBZKx7MnpbEhh9jyipgxe19OcubqV5w
April 1, 2024
245505
South Africa
ZAF
true
2
1
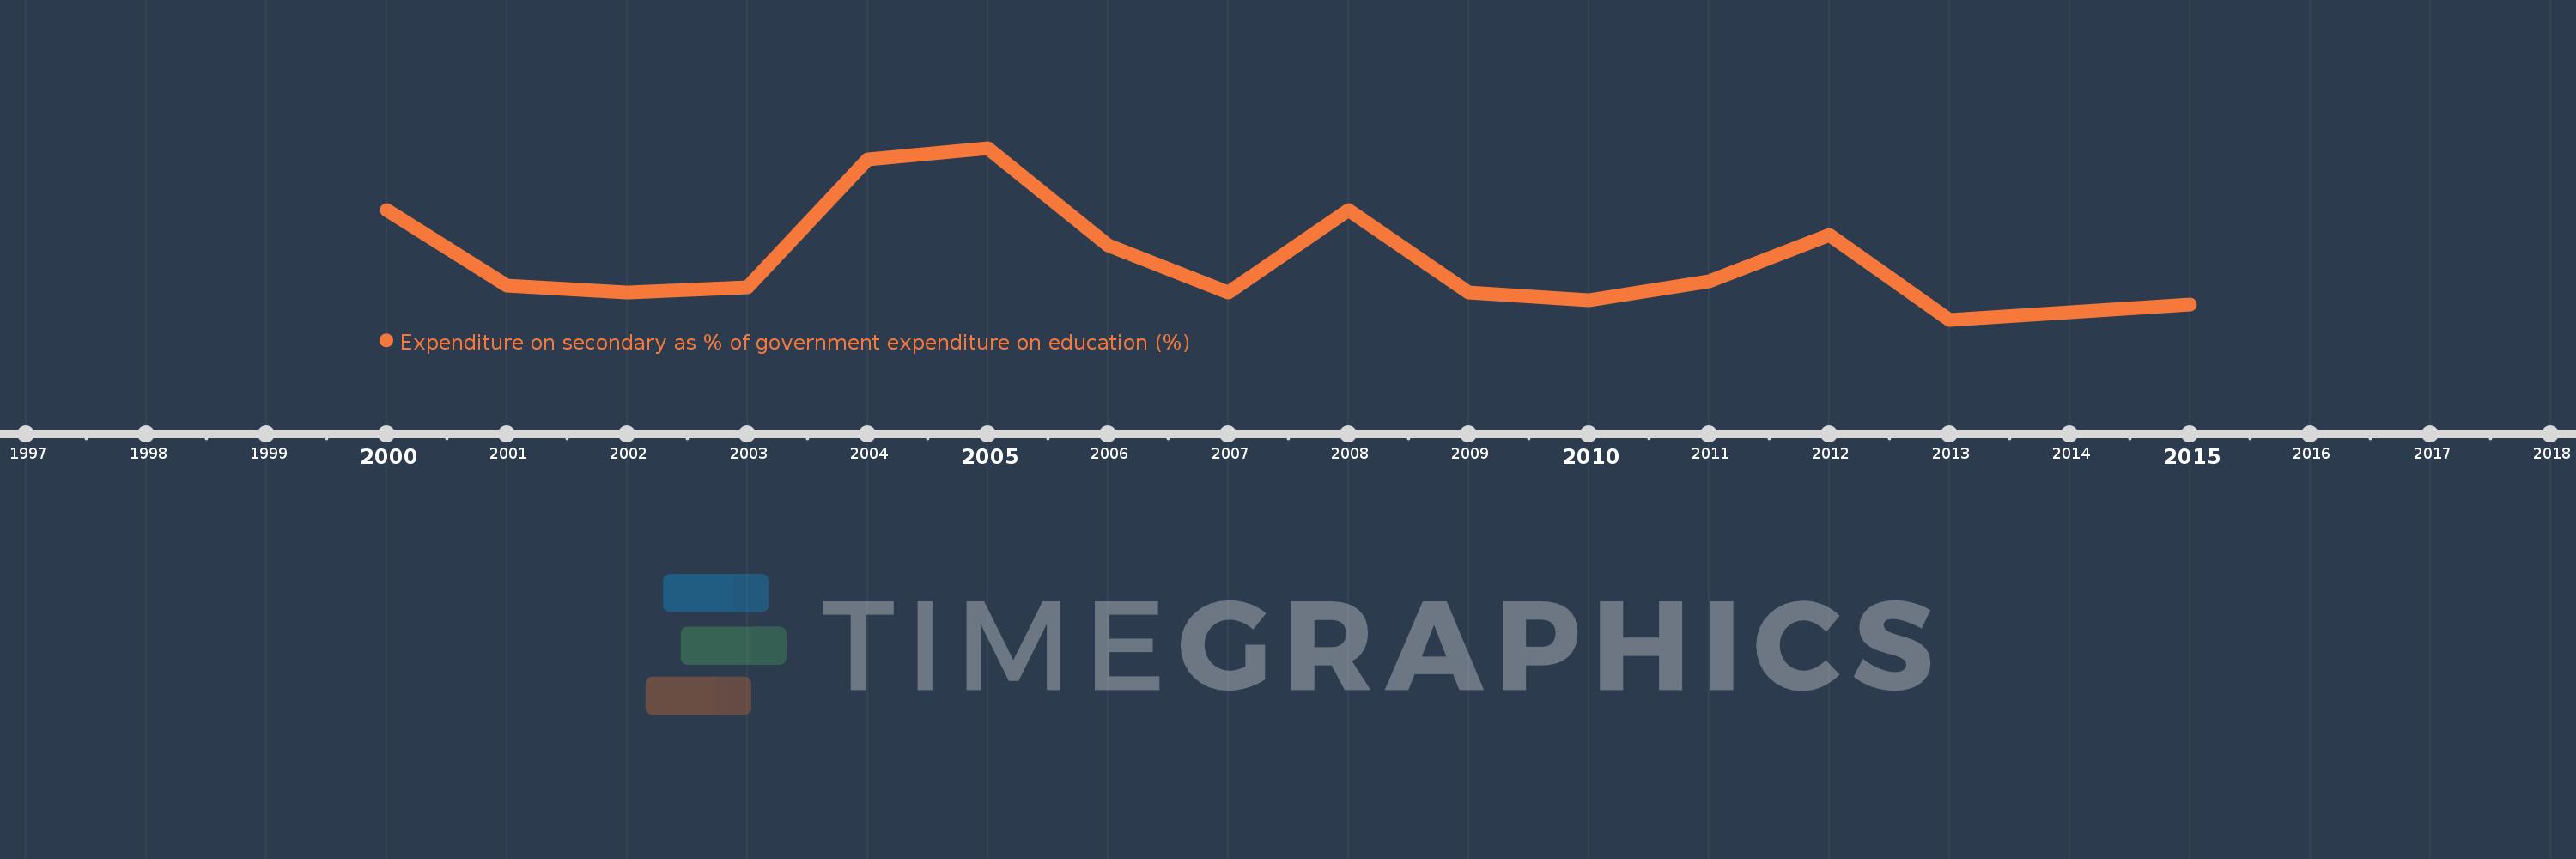
Expenditure on secondary as % of government expenditure on education (%)
2015,2013,2012,2011,2010,2009,2008,2007,2006,2005,2004,2003,2002,2001,2000
This statistics in other country:
Timeline:
This timeline shows a graph from 2000 to 2015 of South Africa. No data until 1999. Number of actual observations by date: 15.
Source name:
World Development Indicators
Source organization:
UNESCO Institute for Statistics
Categories, topics:
Education
Last updated:
apr 23, 2017
Indicators value changes by year
Minimum:
30.256
jan 1, 2013
At the date of observation
Value
Absolute change
Change from previous value
jan 1, 2000
33.685
+33.685
0.0%
jan 1, 2001
31.327
-2.358
-7.0%
jan 1, 2002
31.118
-0.21
-0.67%
jan 1, 2003
31.263
+0.146
0.47%
jan 1, 2004
35.279
+4.016
12.84%
jan 1, 2005
35.63
+0.352
1.0%
jan 1, 2006
32.577
-3.054
-8.57%
jan 1, 2007
31.095
-1.482
-4.55%
jan 1, 2008
33.684
+2.589
8.33%
jan 1, 2009
31.116
-2.568
-7.62%
jan 1, 2010
30.879
-0.237
-0.76%
jan 1, 2011
31.449
+0.571
1.85%
jan 1, 2012
32.917
+1.467
4.67%
jan 1, 2013
30.256
-2.661
-8.08%
jan 1, 2015
30.72
+0.464
1.53%
Ranking of countries by current statistics by years


Comments: