29
/
en
AIzaSyAYiBZKx7MnpbEhh9jyipgxe19OcubqV5w
April 1, 2024
78161
Bangladesh
BGD
true
2
1
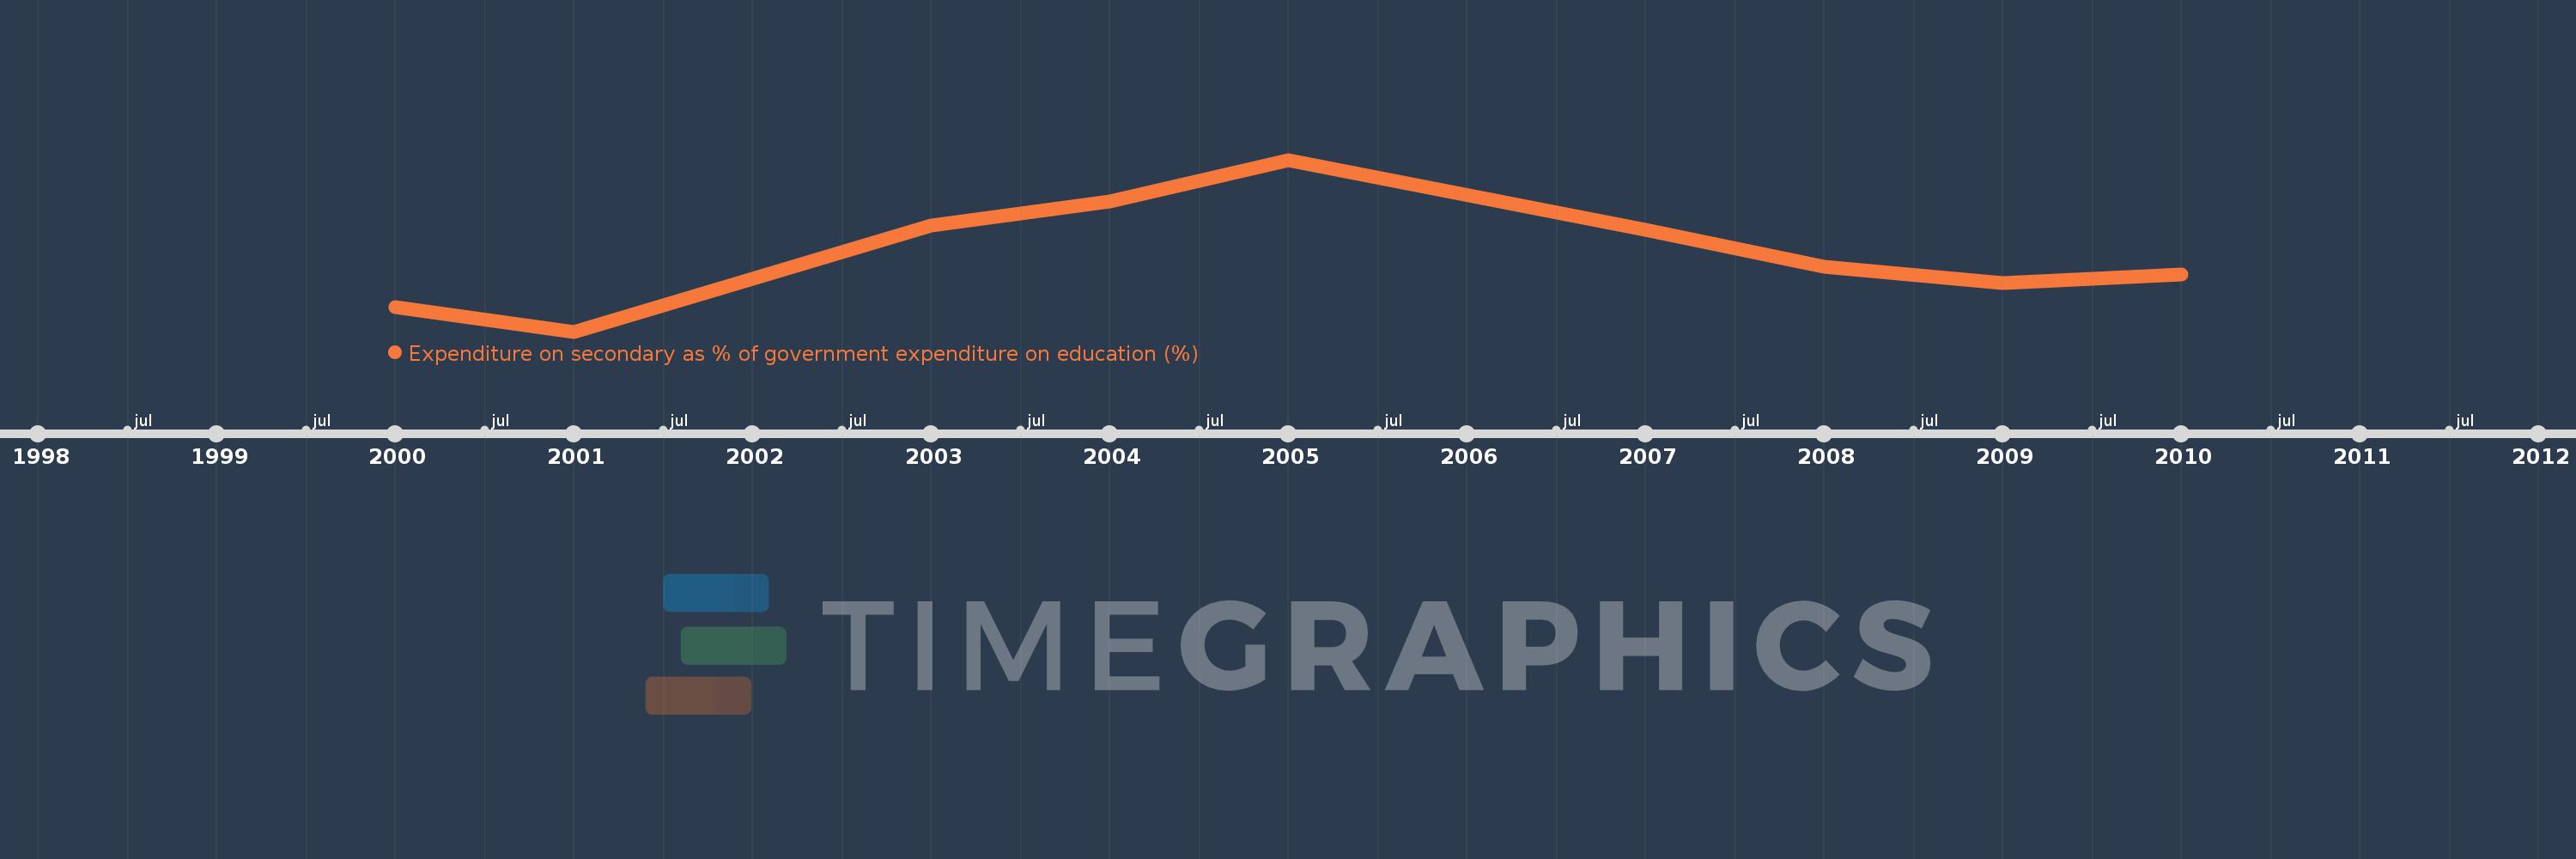
Expenditure on secondary as % of government expenditure on education (%)
2010,2009,2008,2007,2005,2004,2003,2001,2000
This statistics in other country:
Timeline:
This timeline shows a graph from 2000 to 2010 of Bangladesh. No data until 1999. Number of actual observations by date: 9.
Source name:
World Development Indicators
Source organization:
UNESCO Institute for Statistics
Categories, topics:
Education
Last updated:
apr 23, 2017
Indicators value changes by year
Minimum:
36.106
jan 1, 2001
Maximum:
48.471
jan 1, 2005
At the date of observation
Value
Absolute change
Change from previous value
jan 1, 2000
37.852
+37.852
0.0%
jan 1, 2001
36.106
-1.746
-4.61%
jan 1, 2003
43.756
+7.65
21.19%
jan 1, 2004
45.462
+1.706
3.9%
jan 1, 2005
48.471
+3.009
6.62%
jan 1, 2007
43.422
-5.048
-10.41%
jan 1, 2008
40.782
-2.641
-6.08%
jan 1, 2009
39.592
-1.19
-2.92%
jan 1, 2010
40.206
+0.614
1.55%
Ranking of countries by current statistics by years


Comments: