29
/
en
AIzaSyAYiBZKx7MnpbEhh9jyipgxe19OcubqV5w
April 1, 2024
103532
Chad
TCD
true
2
1
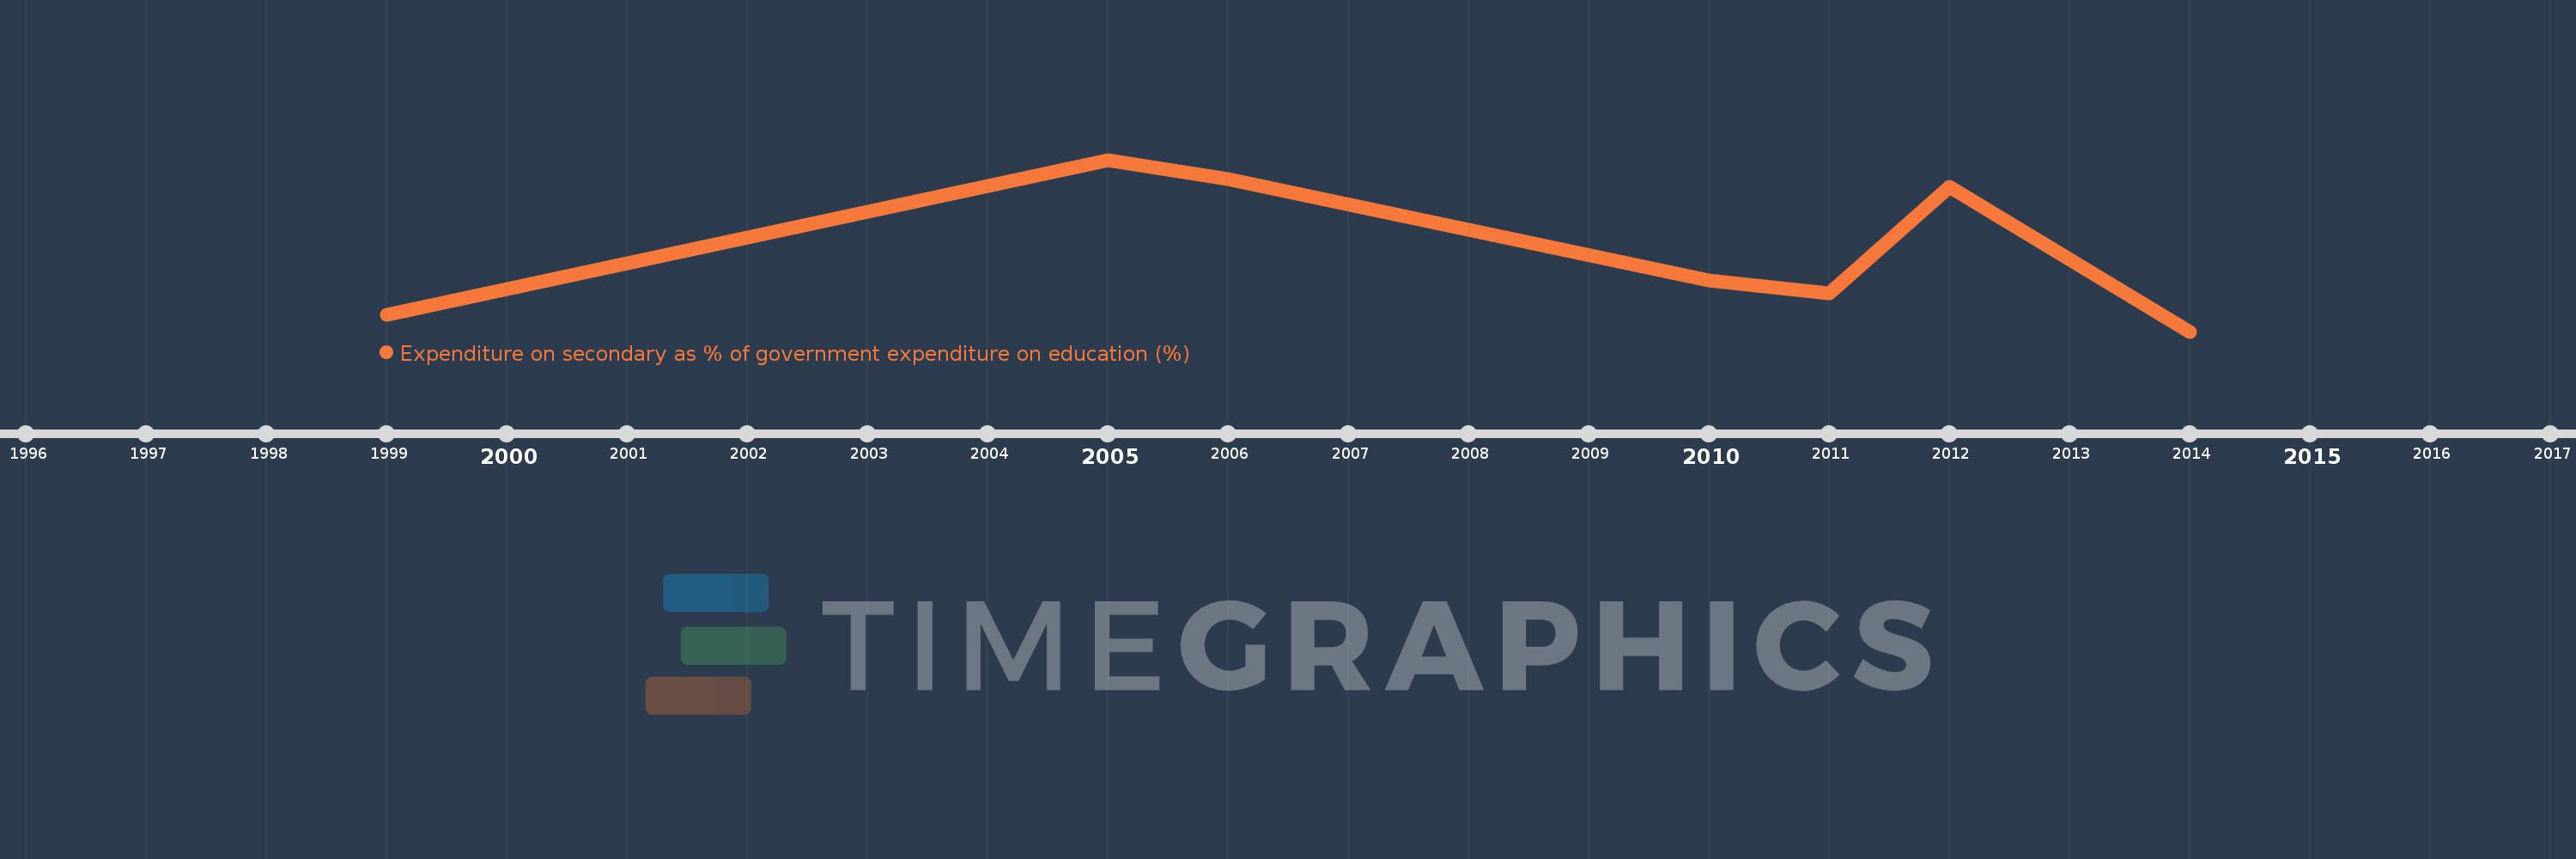
Expenditure on secondary as % of government expenditure on education (%)
2014,2012,2011,2010,2006,2005,1999
This statistics in other country:
Timeline:
This timeline shows a graph from 1999 to 2014 of Chad. No data until 1998. Number of actual observations by date: 7.
Source name:
World Development Indicators
Source organization:
UNESCO Institute for Statistics
Categories, topics:
Education
Last updated:
apr 23, 2017
Indicators value changes by year
Minimum:
24.712
jan 1, 2014
Maximum:
36.856
jan 1, 2005
At the date of observation
Value
Absolute change
Change from previous value
jan 1, 1999
25.918
+25.918
0.0%
jan 1, 2005
36.856
+10.938
42.2%
jan 1, 2006
35.485
-1.371
-3.72%
jan 1, 2010
28.334
-7.151
-20.15%
jan 1, 2011
27.406
-0.928
-3.28%
jan 1, 2012
34.949
+7.543
27.52%
jan 1, 2014
24.712
-10.237
-29.29%
Ranking of countries by current statistics by years


Comments: