29
/
en
AIzaSyAYiBZKx7MnpbEhh9jyipgxe19OcubqV5w
April 1, 2024
68732
Antigua and Barbuda
ATG
true
2
1
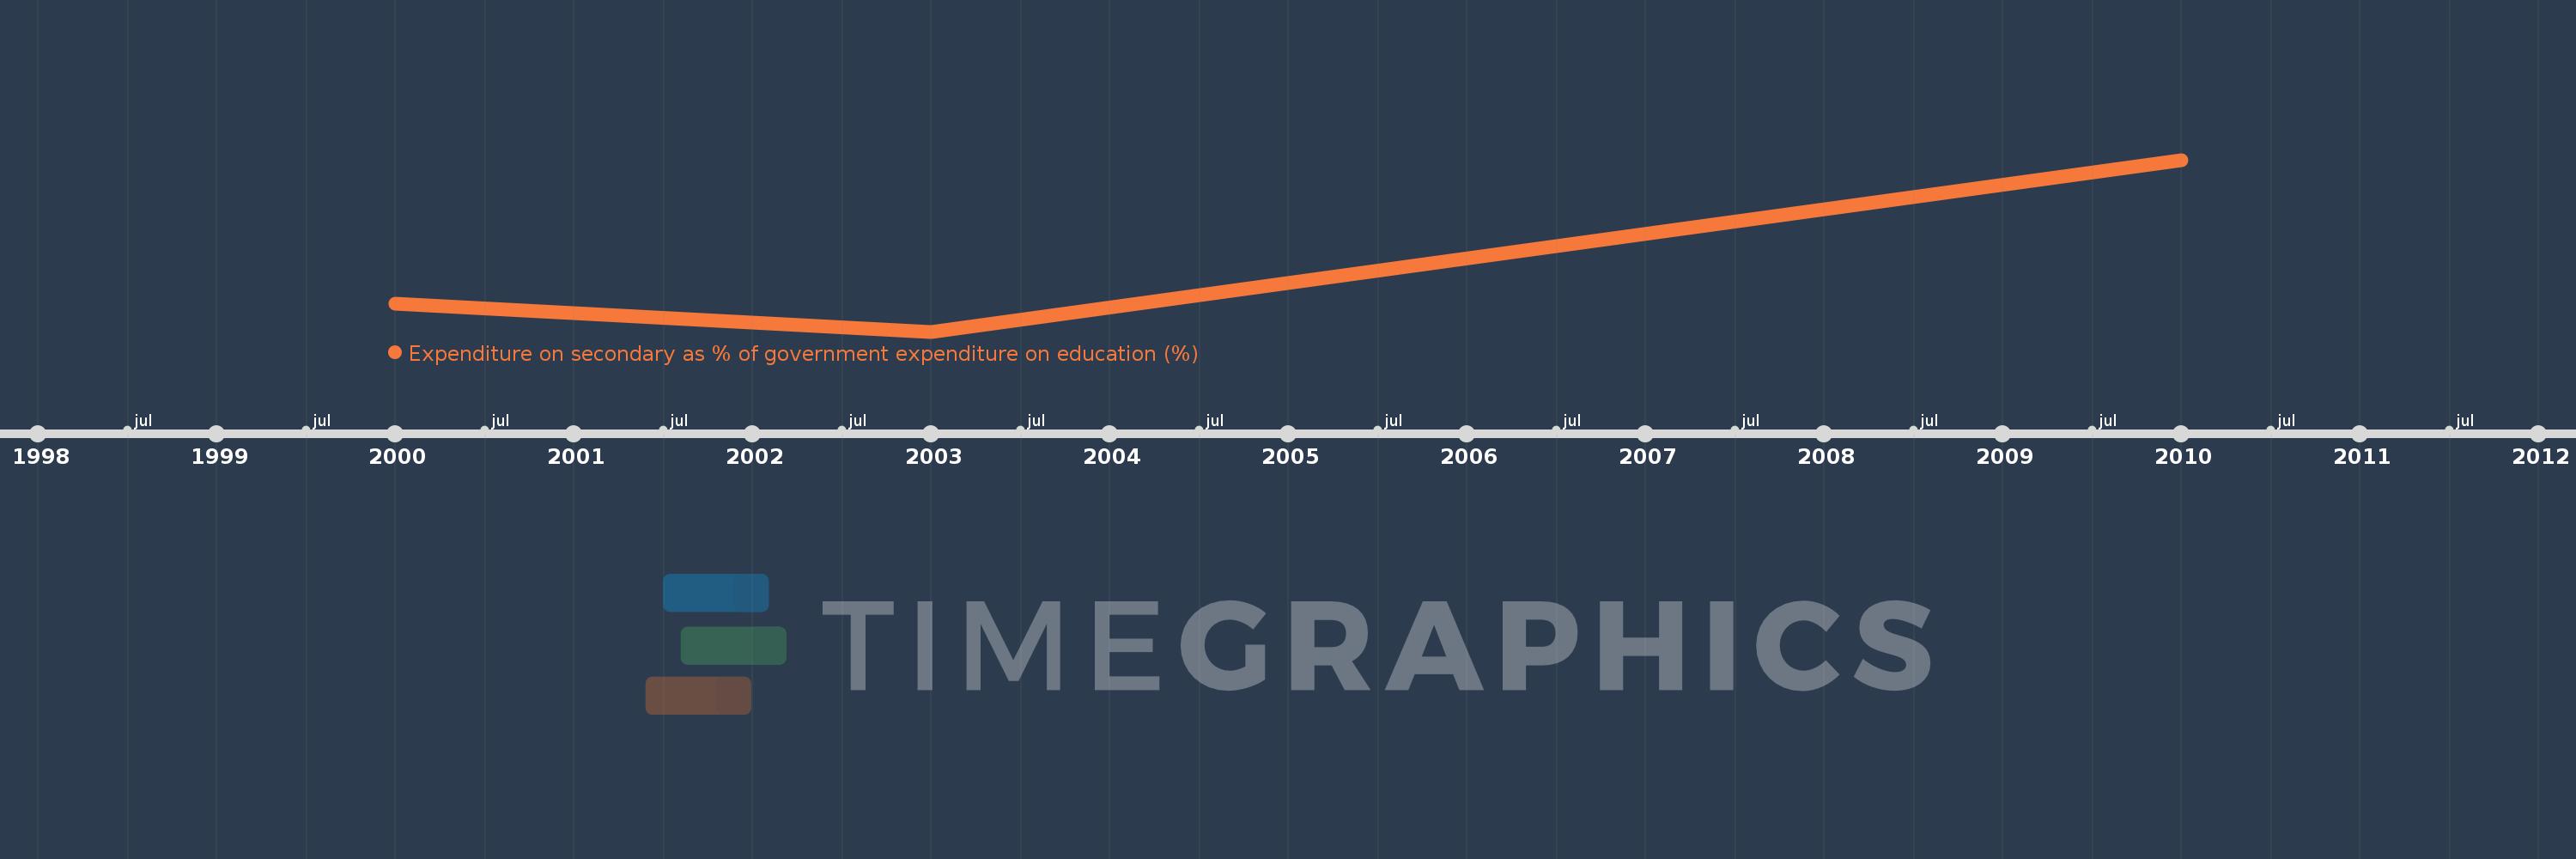
Expenditure on secondary as % of government expenditure on education (%)
2010,2003,2000
This statistics in other country:
Timeline:
This timeline shows a graph from 2000 to 2010 of Antigua and Barbuda. No data until 1999. Number of actual observations by date: 3.
Source name:
World Development Indicators
Source organization:
UNESCO Institute for Statistics
Categories, topics:
Education
Last updated:
apr 23, 2017
Indicators value changes by year
Minimum:
35.152
jan 1, 2003
Maximum:
48.392
jan 1, 2010
At the date of observation
Value
Absolute change
Change from previous value
jan 1, 2000
37.281
+37.281
0.0%
jan 1, 2003
35.152
-2.129
-5.71%
jan 1, 2010
48.392
+13.24
37.67%
Ranking of countries by current statistics by years


Comments: