29
/
en
AIzaSyAYiBZKx7MnpbEhh9jyipgxe19OcubqV5w
April 1, 2024
251826
St. Vincent and the Grenadines
VCT
true
2
1
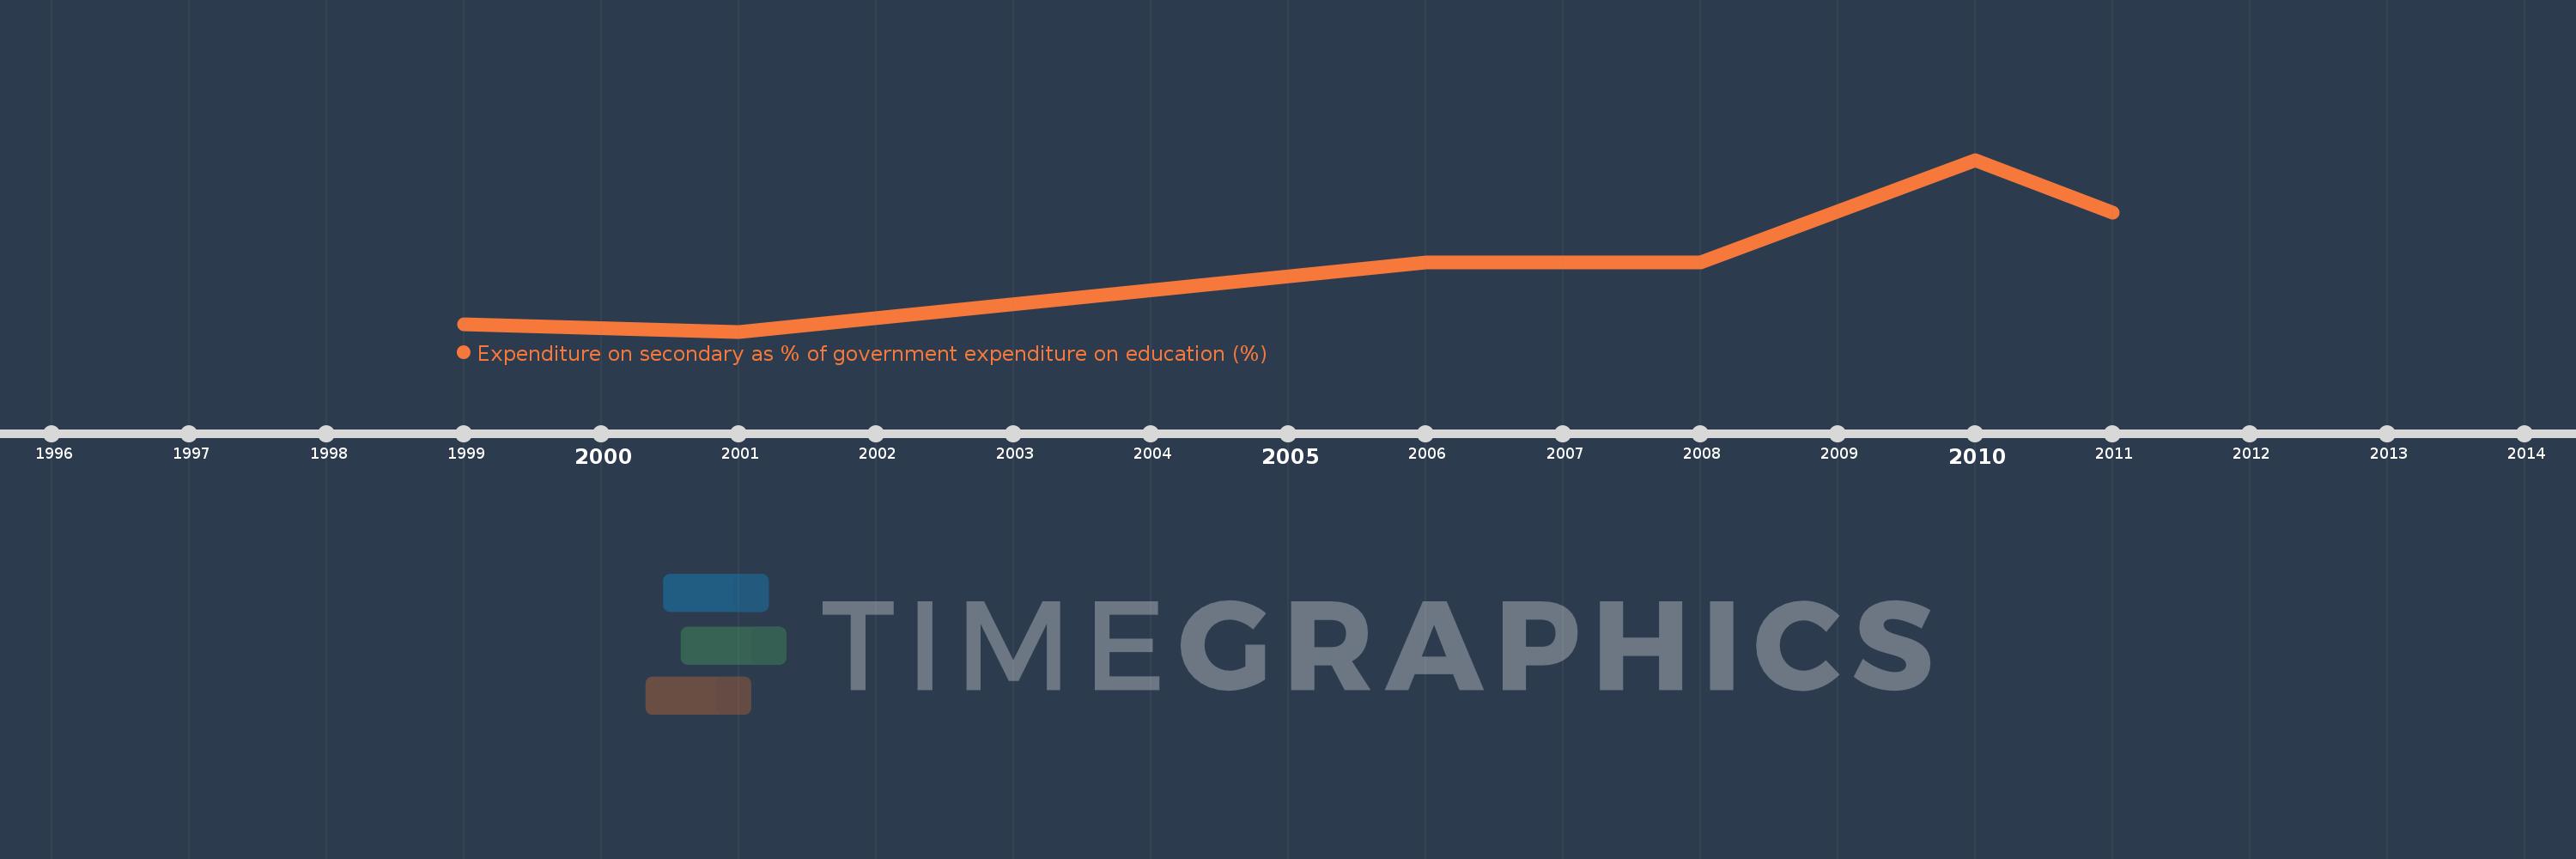
Expenditure on secondary as % of government expenditure on education (%)
2011,2010,2008,2006,2001,1999
This statistics in other country:
Timeline:
This timeline shows a graph from 1999 to 2011 of St. Vincent and the Grenadines. No data until 1998. Number of actual observations by date: 6.
Source name:
World Development Indicators
Source organization:
UNESCO Institute for Statistics
Categories, topics:
Education
Last updated:
apr 23, 2017
Indicators value changes by year
Minimum:
25.475
jan 1, 2001
Maximum:
41.084
jan 1, 2010
At the date of observation
Value
Absolute change
Change from previous value
jan 1, 1999
26.117
+26.117
0.0%
jan 1, 2001
25.475
-0.642
-2.46%
jan 1, 2006
31.727
+6.251
24.54%
jan 1, 2008
31.783
+0.056
0.18%
jan 1, 2010
41.084
+9.302
29.27%
jan 1, 2011
36.268
-4.816
-11.72%
Ranking of countries by current statistics by years


Comments: