29
/
en
AIzaSyAYiBZKx7MnpbEhh9jyipgxe19OcubqV5w
April 1, 2024
84008
Benin
BEN
true
2
1
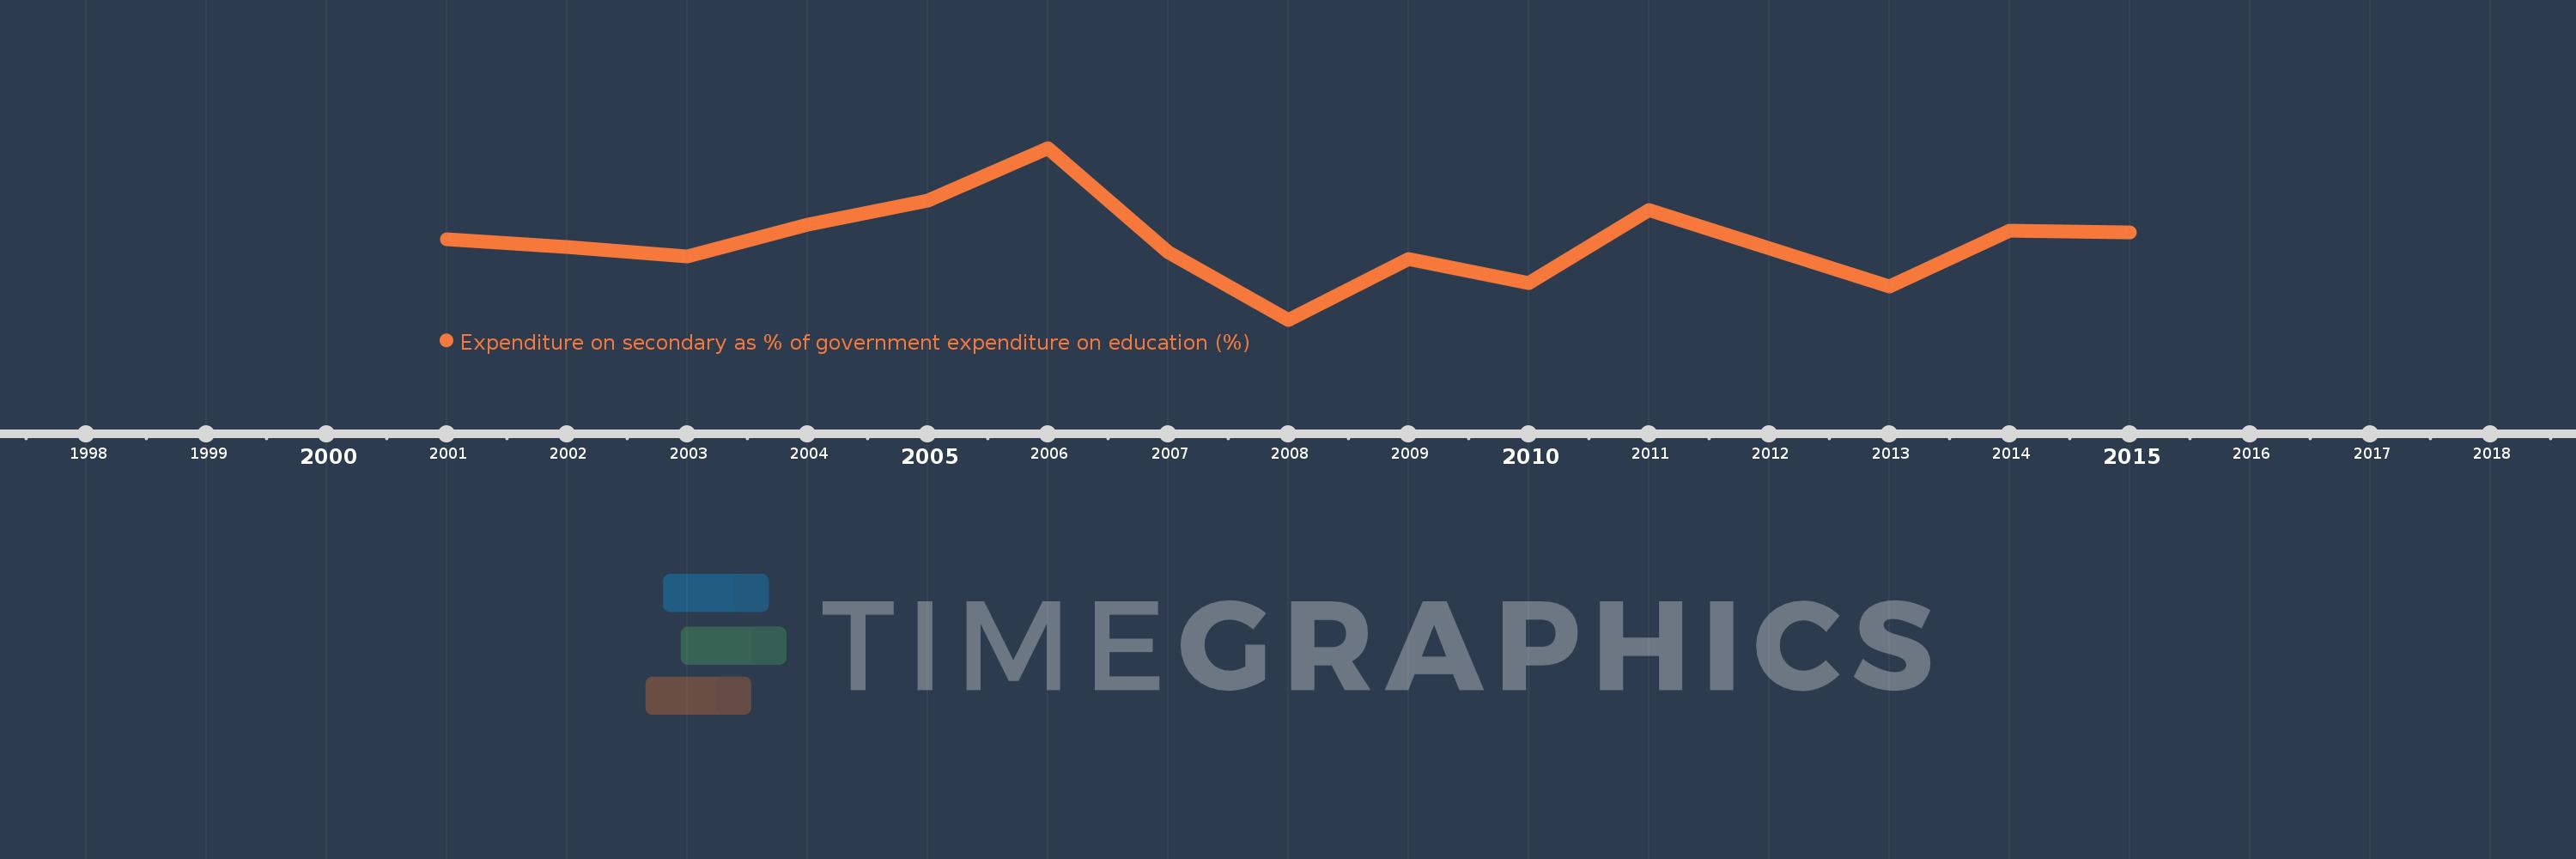
Expenditure on secondary as % of government expenditure on education (%)
2015,2014,2013,2011,2010,2009,2008,2007,2006,2005,2004,2003,2002,2001
This statistics in other country:
Timeline:
This timeline shows a graph from 2001 to 2015 of Benin. No data until 2000. Number of actual observations by date: 14.
Source name:
World Development Indicators
Source organization:
UNESCO Institute for Statistics
Categories, topics:
Education
Last updated:
apr 23, 2017
Indicators value changes by year
Minimum:
19.396
jan 1, 2008
Maximum:
32.827
jan 1, 2006
At the date of observation
Value
Absolute change
Change from previous value
jan 1, 2001
25.693
+25.693
0.0%
jan 1, 2002
25.103
-0.59
-2.29%
jan 1, 2003
24.332
-0.771
-3.07%
jan 1, 2004
26.81
+2.478
10.18%
jan 1, 2005
28.691
+1.881
7.02%
jan 1, 2006
32.827
+4.136
14.42%
jan 1, 2007
24.676
-8.151
-24.83%
jan 1, 2008
19.396
-5.28
-21.4%
jan 1, 2009
24.149
+4.753
24.5%
jan 1, 2010
22.234
-1.915
-7.93%
jan 1, 2011
27.983
+5.748
25.85%
jan 1, 2013
21.971
-6.012
-21.48%
jan 1, 2014
26.364
+4.393
19.99%
jan 1, 2015
26.252
-0.112
-0.42%
Ranking of countries by current statistics by years


Comments: