29
/
en
AIzaSyAYiBZKx7MnpbEhh9jyipgxe19OcubqV5w
April 1, 2024
118847
Denmark
DNK
true
2
1
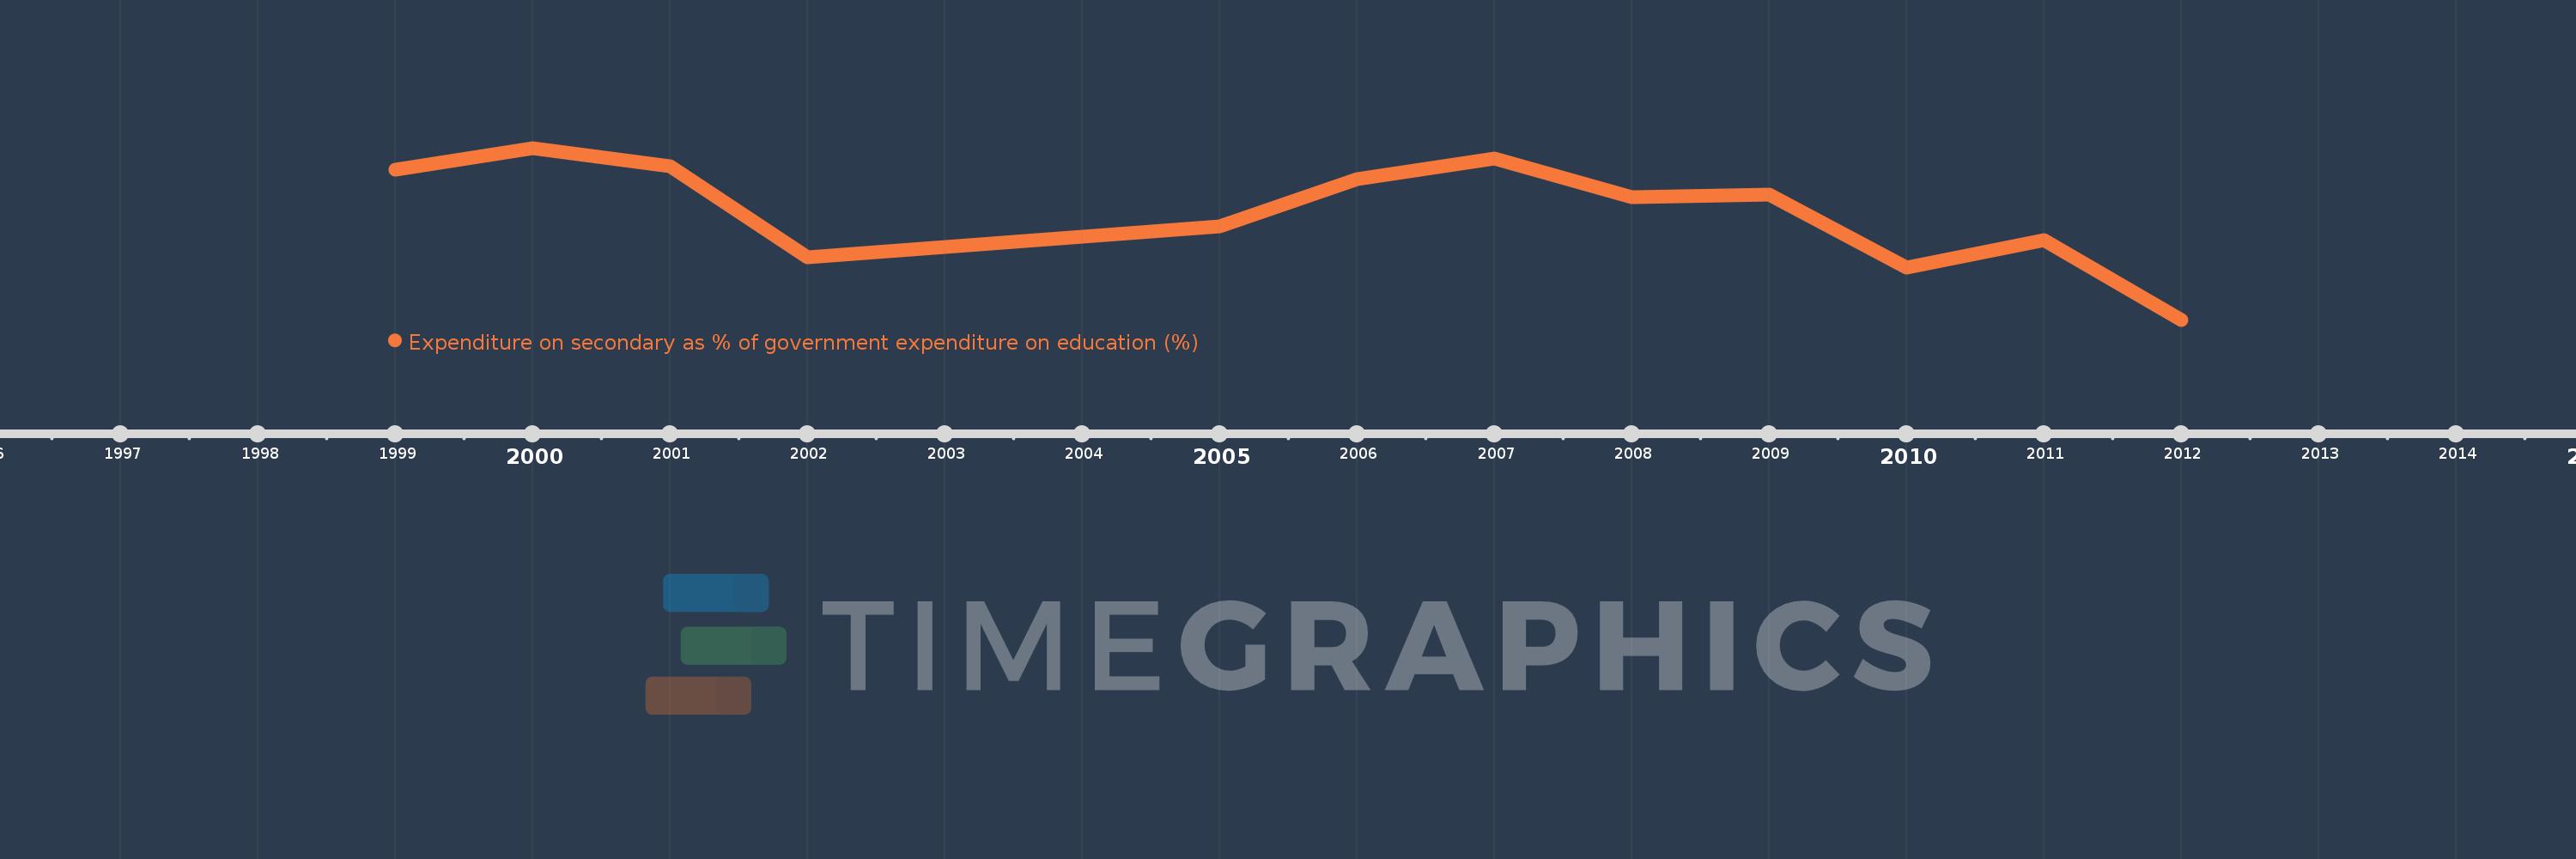
Expenditure on secondary as % of government expenditure on education (%)
2012,2011,2010,2009,2008,2007,2006,2005,2004,2003,2002,2001,2000,1999
This statistics in other country:
Timeline:
This timeline shows a graph from 1999 to 2012 of Denmark. No data until 1998. Number of actual observations by date: 14.
Source name:
World Development Indicators
Source organization:
UNESCO Institute for Statistics
Categories, topics:
Education
Last updated:
apr 23, 2017
Indicators value changes by year
Minimum:
32.102
jan 1, 2012
Maximum:
37.293
jan 1, 2000
At the date of observation
Value
Absolute change
Change from previous value
jan 1, 1999
36.647
+36.647
0.0%
jan 1, 2000
37.293
+0.646
1.76%
jan 1, 2001
36.74
-0.552
-1.48%
jan 1, 2002
33.982
-2.758
-7.51%
jan 1, 2003
34.294
+0.312
0.92%
jan 1, 2004
34.608
+0.315
0.92%
jan 1, 2005
34.922
+0.314
0.91%
jan 1, 2006
36.348
+1.426
4.08%
jan 1, 2007
36.986
+0.638
1.76%
jan 1, 2008
35.808
-1.178
-3.18%
jan 1, 2009
35.895
+0.086
0.24%
jan 1, 2010
33.69
-2.205
-6.14%
jan 1, 2011
34.519
+0.829
2.46%
jan 1, 2012
32.102
-2.417
-7.0%
Ranking of countries by current statistics by years


Comments: