29
/
en
AIzaSyAYiBZKx7MnpbEhh9jyipgxe19OcubqV5w
April 1, 2024
224777
Poland
POL
true
2
1
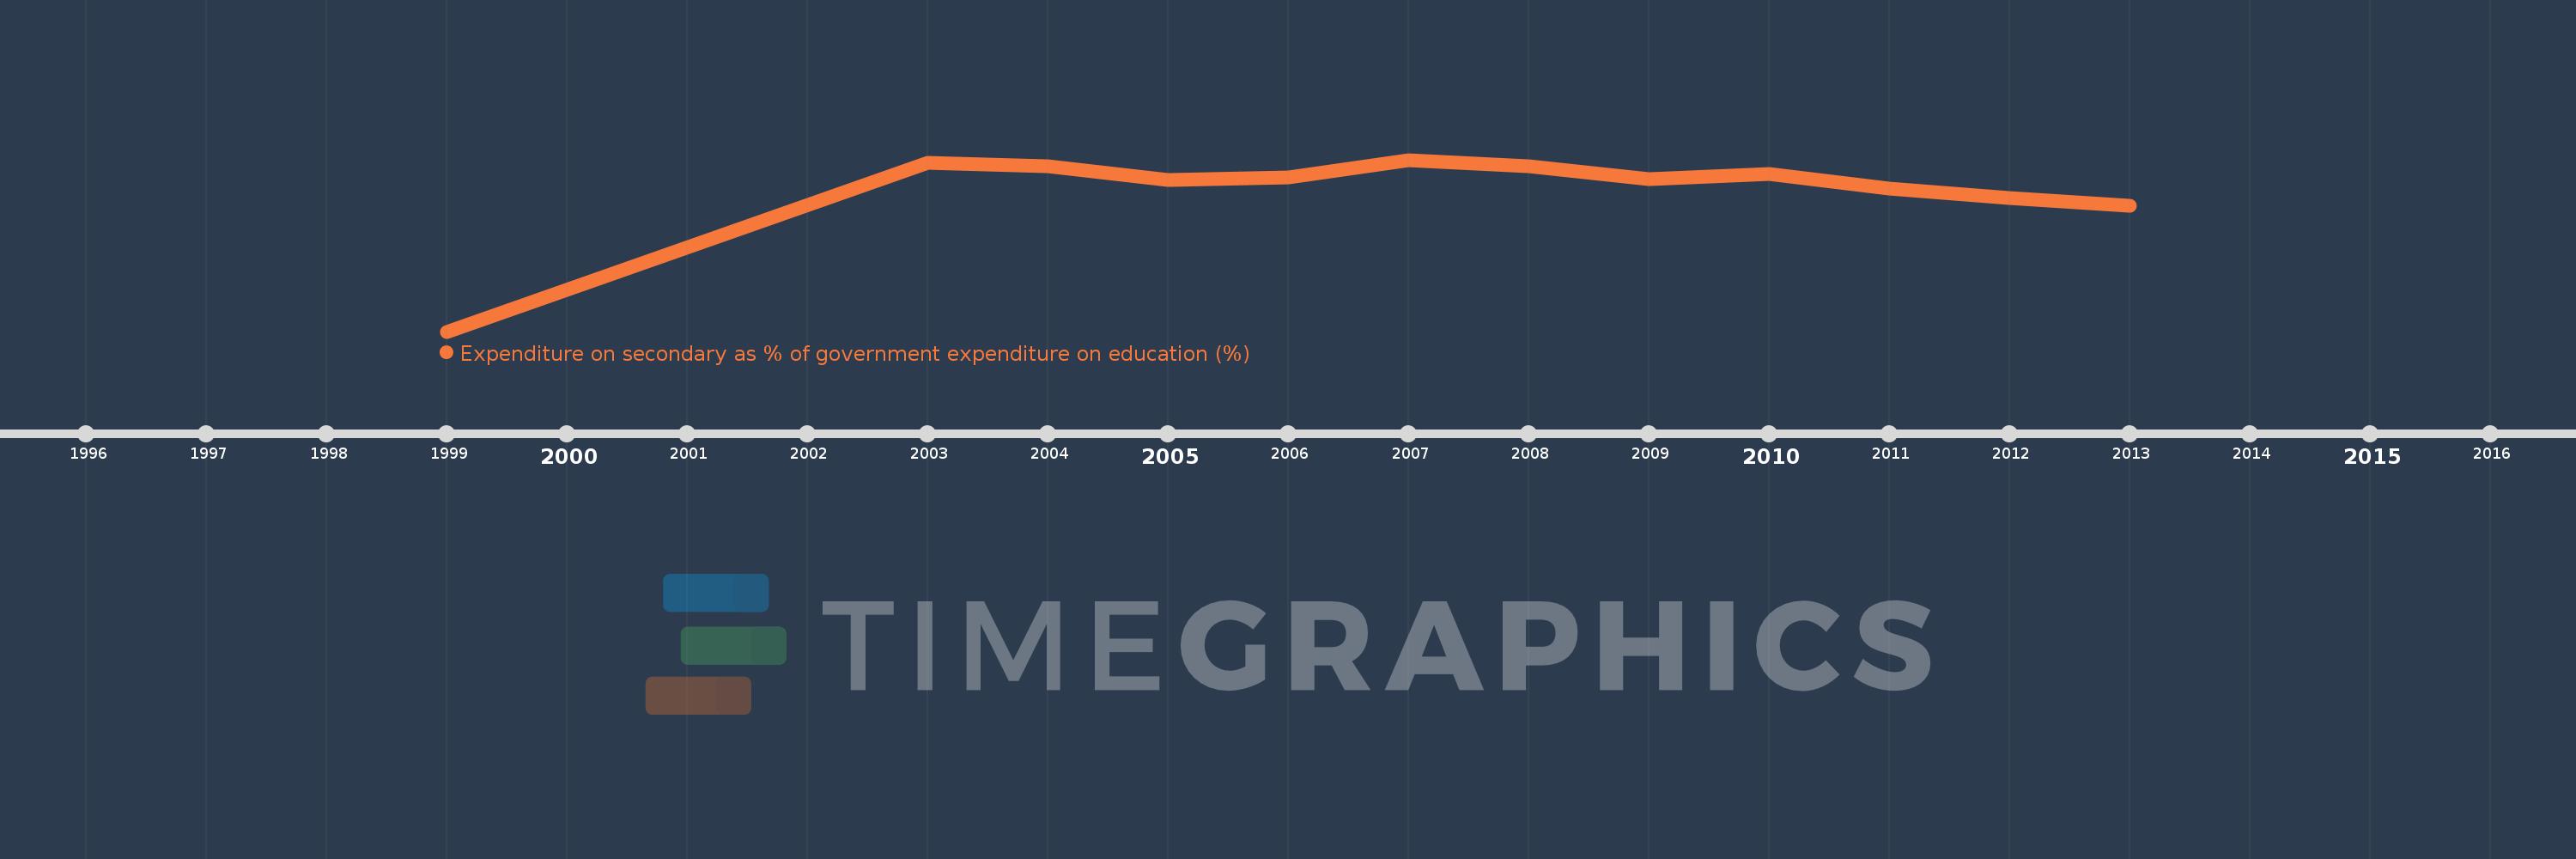
Expenditure on secondary as % of government expenditure on education (%)
2013,2012,2011,2010,2009,2008,2007,2006,2005,2004,2003,1999
This statistics in other country:
Timeline:
This timeline shows a graph from 1999 to 2013 of Poland. No data until 1998. Number of actual observations by date: 12.
Source name:
World Development Indicators
Source organization:
UNESCO Institute for Statistics
Categories, topics:
Education
Last updated:
apr 23, 2017
Indicators value changes by year
Minimum:
22.207
jan 1, 1999
Maximum:
38.222
jan 1, 2007
At the date of observation
Value
Absolute change
Change from previous value
jan 1, 1999
22.207
+22.207
0.0%
jan 1, 2003
37.934
+15.726
70.82%
jan 1, 2004
37.643
-0.291
-0.77%
jan 1, 2005
36.371
-1.272
-3.38%
jan 1, 2006
36.61
+0.239
0.66%
jan 1, 2007
38.222
+1.612
4.4%
jan 1, 2008
37.62
-0.601
-1.57%
jan 1, 2009
36.442
-1.178
-3.13%
jan 1, 2010
36.899
+0.457
1.25%
jan 1, 2011
35.503
-1.396
-3.78%
jan 1, 2012
34.644
-0.859
-2.42%
jan 1, 2013
33.954
-0.69
-1.99%
Ranking of countries by current statistics by years


Comments: