29
/
en
AIzaSyAYiBZKx7MnpbEhh9jyipgxe19OcubqV5w
April 1, 2024
250706
St. Lucia
LCA
true
2
1
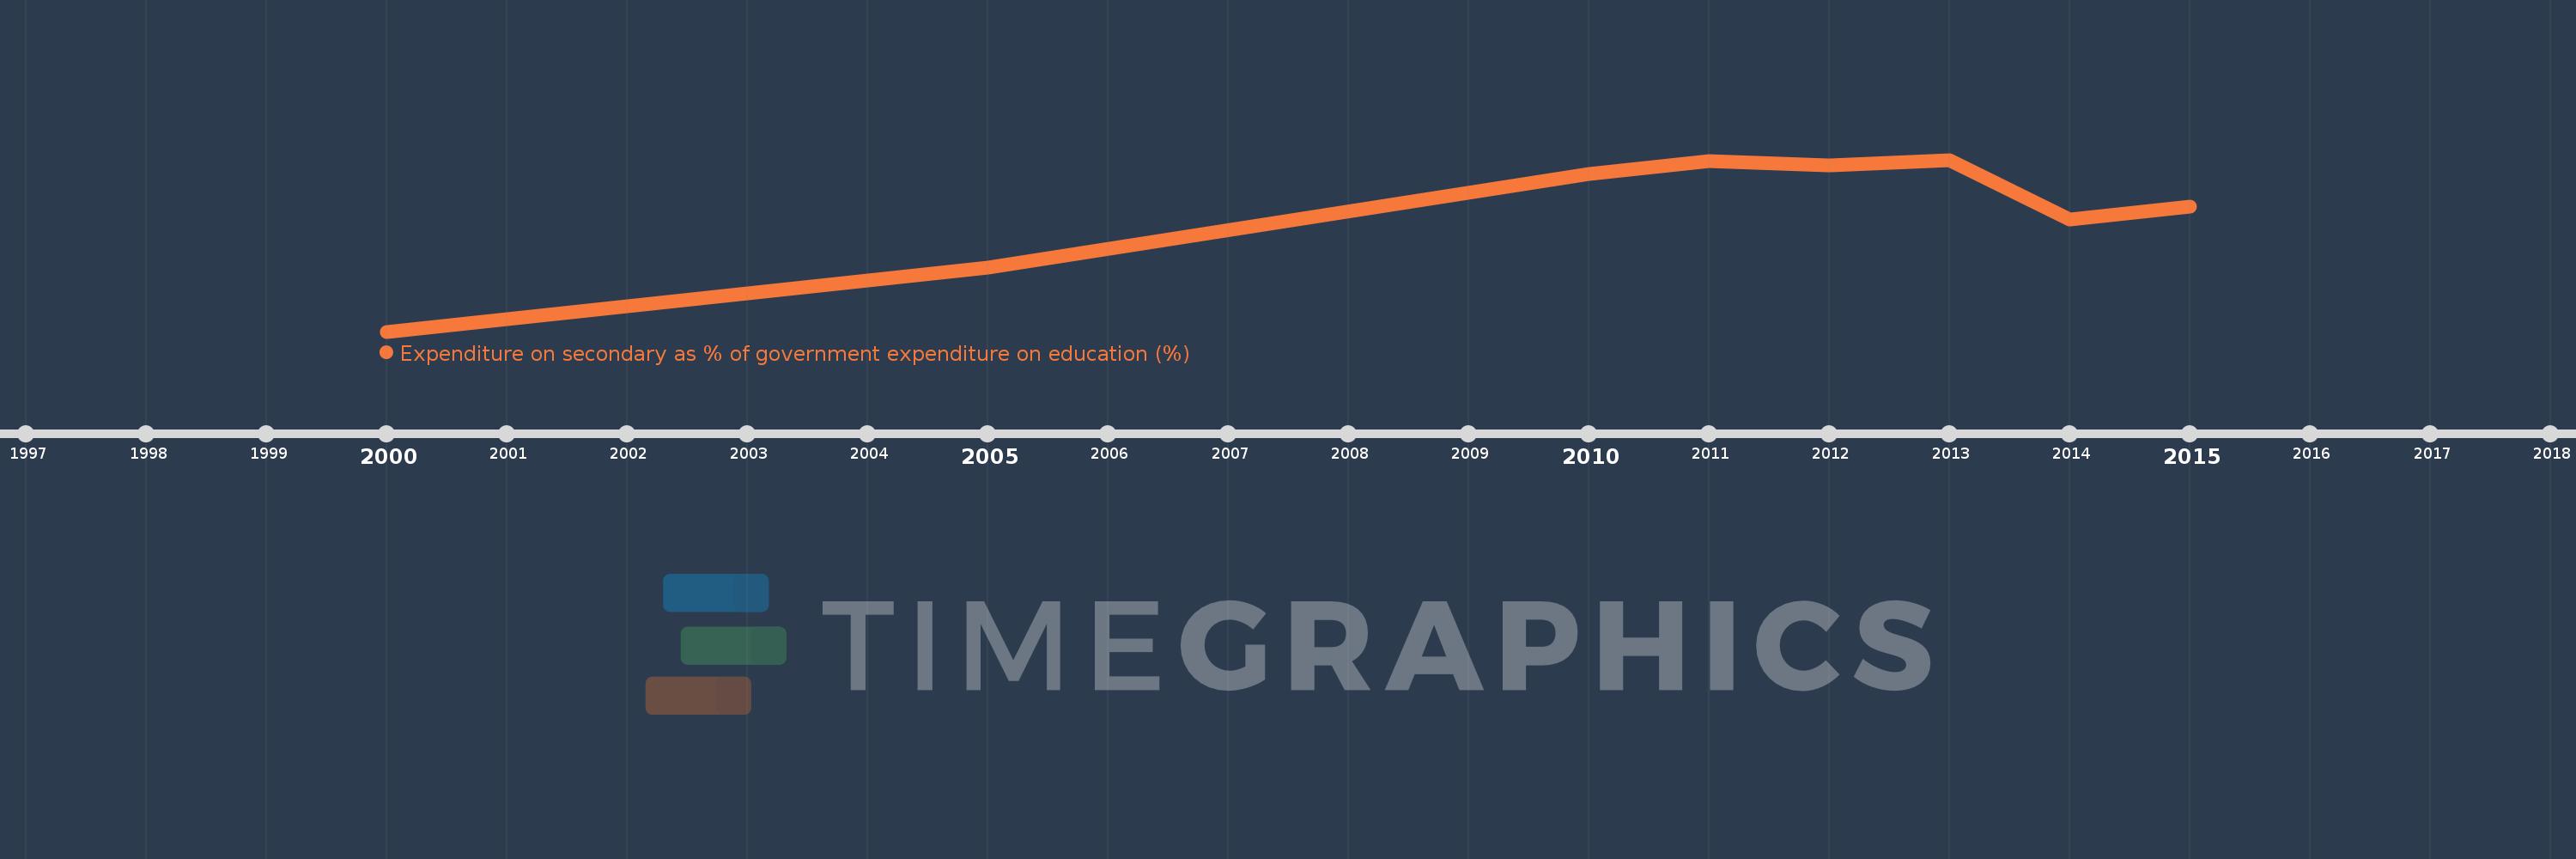
Expenditure on secondary as % of government expenditure on education (%)
2015,2014,2013,2012,2011,2010,2005,2000
This statistics in other country:
Timeline:
This timeline shows a graph from 2000 to 2015 of St. Lucia. No data until 1999. Number of actual observations by date: 8.
Source name:
World Development Indicators
Source organization:
UNESCO Institute for Statistics
Categories, topics:
Education
Last updated:
apr 23, 2017
Indicators value changes by year
Minimum:
26.028
jan 1, 2000
Maximum:
45.714
jan 1, 2013
At the date of observation
Value
Absolute change
Change from previous value
jan 1, 2000
26.028
+26.028
0.0%
jan 1, 2005
33.399
+7.371
28.32%
jan 1, 2010
44.093
+10.694
32.02%
jan 1, 2011
45.584
+1.492
3.38%
jan 1, 2012
45.076
-0.509
-1.12%
jan 1, 2013
45.714
+0.639
1.42%
jan 1, 2014
38.885
-6.829
-14.94%
jan 1, 2015
40.34
+1.455
3.74%
Ranking of countries by current statistics by years


Comments: