29
/
en
AIzaSyAYiBZKx7MnpbEhh9jyipgxe19OcubqV5w
April 1, 2024
181027
Lithuania
LTU
true
2
1
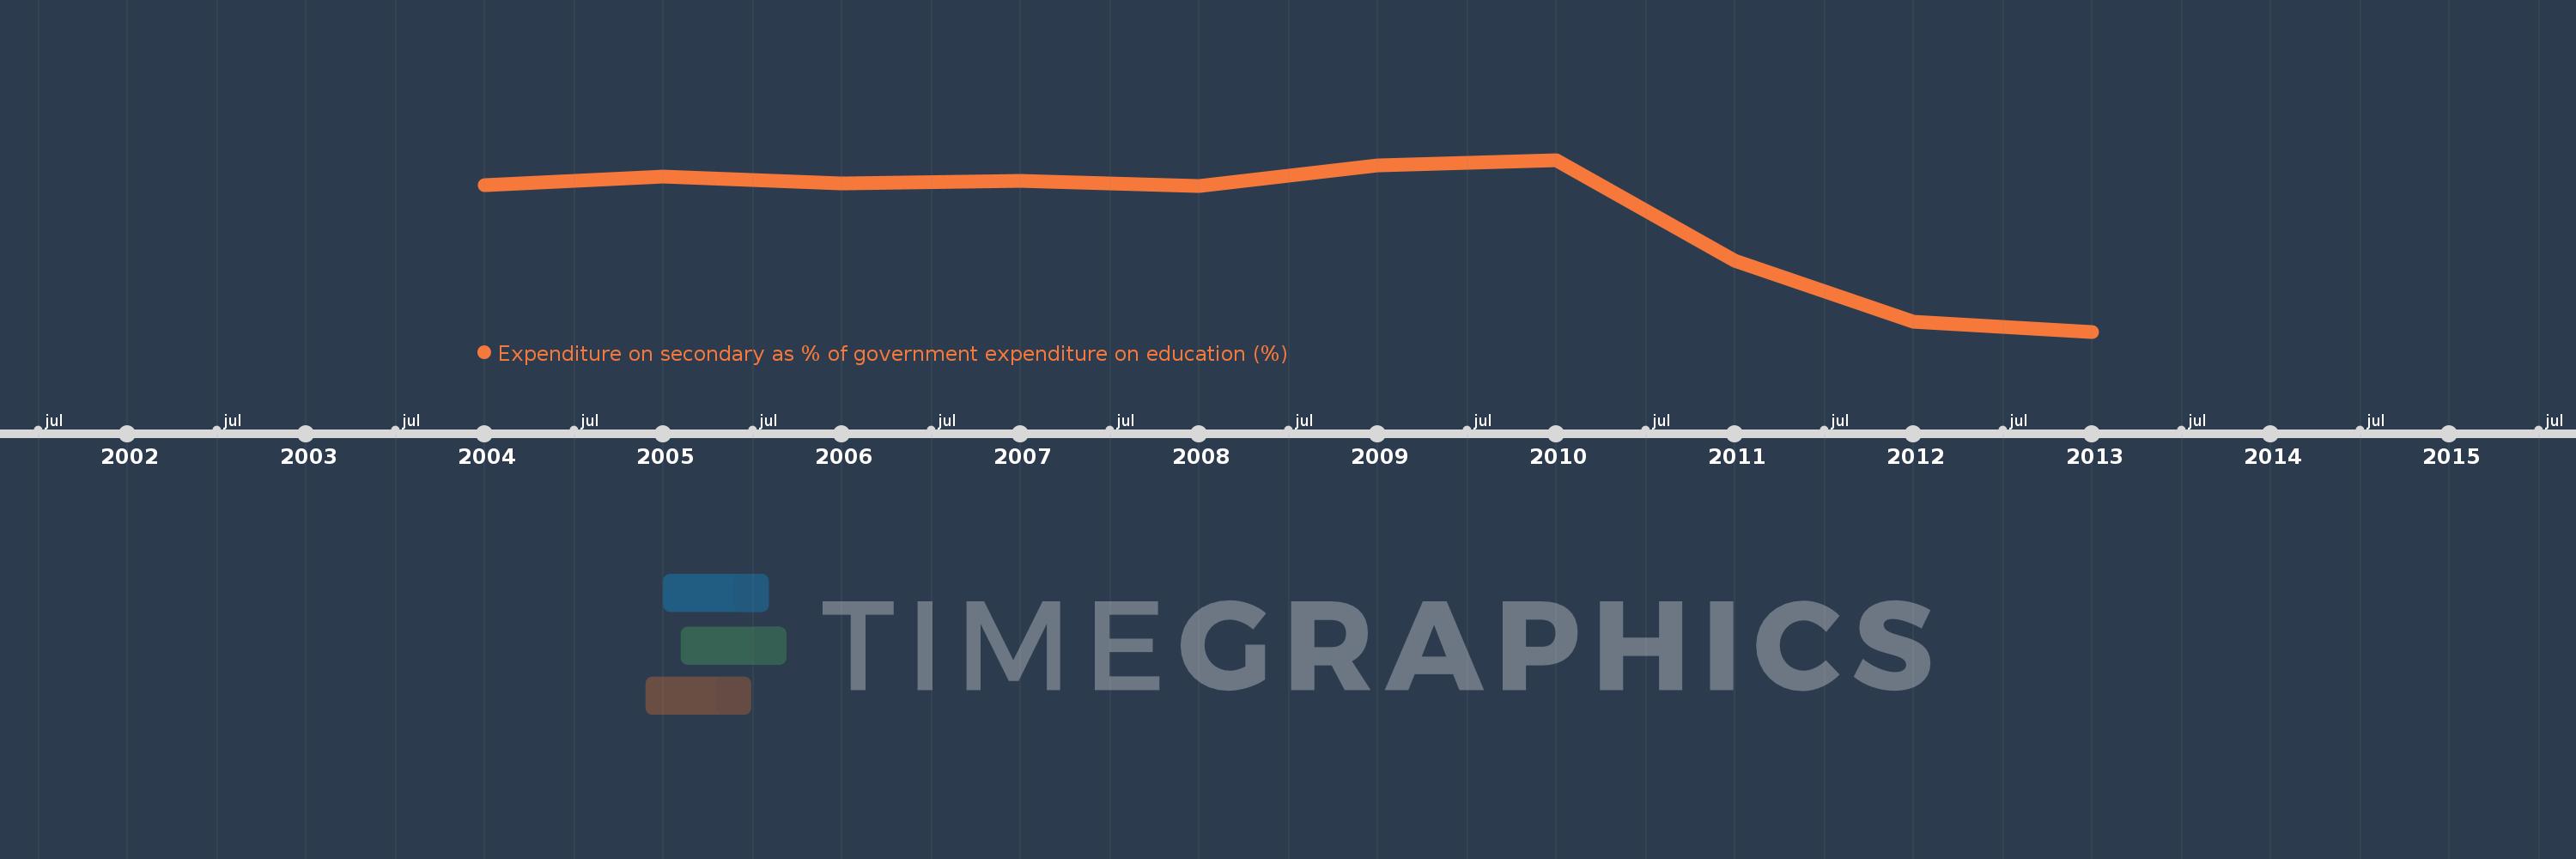
Expenditure on secondary as % of government expenditure on education (%)
2013,2012,2011,2010,2009,2008,2007,2006,2005,2004
This statistics in other country:
Timeline:
This timeline shows a graph from 2004 to 2013 of Lithuania. No data until 2003. Number of actual observations by date: 10.
Source name:
World Development Indicators
Source organization:
UNESCO Institute for Statistics
Categories, topics:
Education
Last updated:
apr 23, 2017
Indicators value changes by year
Minimum:
39.661
jan 1, 2013
Maximum:
52.305
jan 1, 2010
At the date of observation
Value
Absolute change
Change from previous value
jan 1, 2004
50.433
+50.433
0.0%
jan 1, 2005
51.071
+0.638
1.27%
jan 1, 2006
50.561
-0.511
-1.0%
jan 1, 2007
50.773
+0.212
0.42%
jan 1, 2008
50.387
-0.386
-0.76%
jan 1, 2009
51.863
+1.476
2.93%
jan 1, 2010
52.305
+0.442
0.85%
jan 1, 2011
44.859
-7.445
-14.23%
jan 1, 2012
40.416
-4.443
-9.91%
jan 1, 2013
39.661
-0.755
-1.87%
Ranking of countries by current statistics by years


Comments: