29
/
en
AIzaSyAYiBZKx7MnpbEhh9jyipgxe19OcubqV5w
April 1, 2024
264521
Togo
TGO
true
2
1
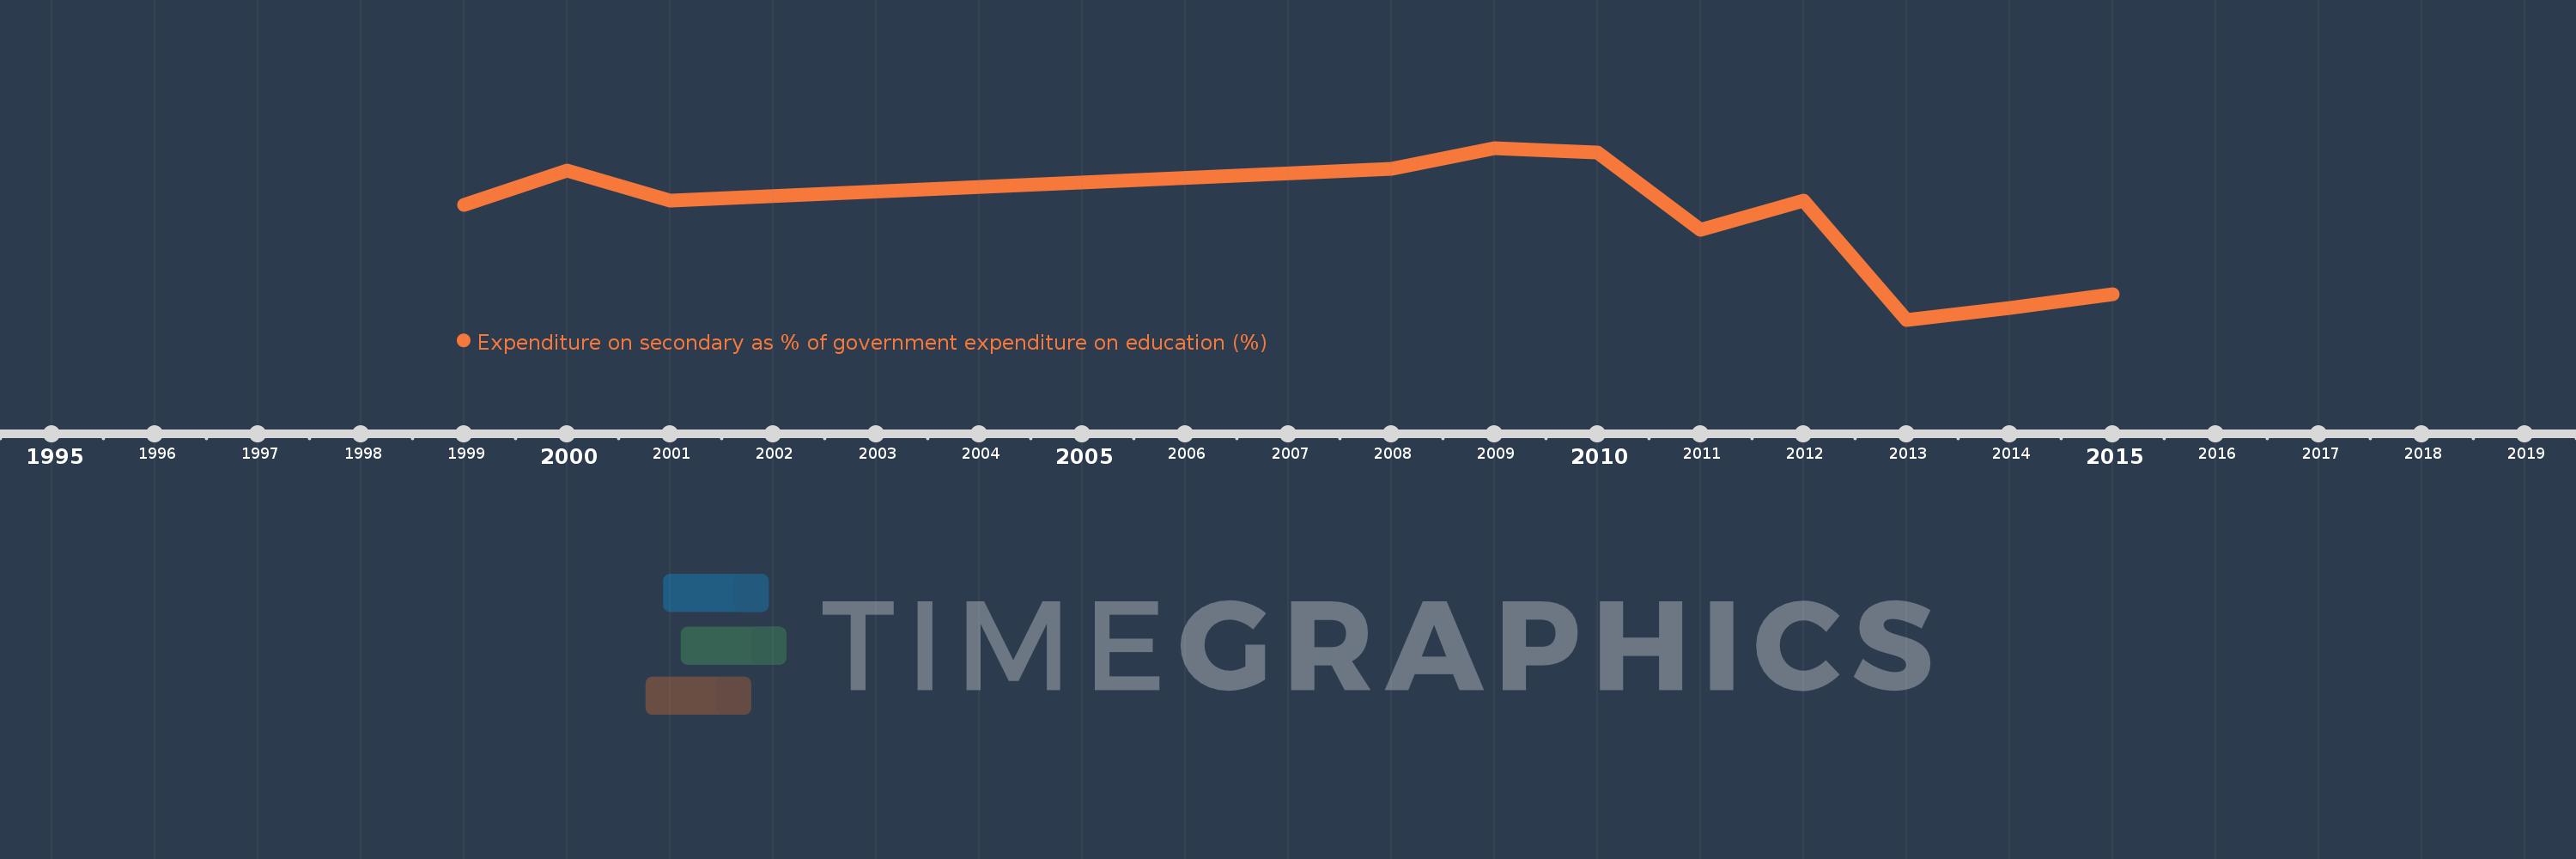
Expenditure on secondary as % of government expenditure on education (%)
2015,2014,2013,2012,2011,2010,2009,2008,2001,2000,1999
This statistics in other country:
Timeline:
This timeline shows a graph from 1999 to 2015 of Togo. No data until 1998. Number of actual observations by date: 11.
Source name:
World Development Indicators
Source organization:
UNESCO Institute for Statistics
Categories, topics:
Education
Last updated:
apr 23, 2017
Indicators value changes by year
Minimum:
14.341
jan 1, 2013
Maximum:
35.893
jan 1, 2009
At the date of observation
Value
Absolute change
Change from previous value
jan 1, 1999
28.696
+28.696
0.0%
jan 1, 2000
33.019
+4.323
15.06%
jan 1, 2001
29.313
-3.705
-11.22%
jan 1, 2008
33.259
+3.945
13.46%
jan 1, 2009
35.893
+2.634
7.92%
jan 1, 2010
35.351
-0.543
-1.51%
jan 1, 2011
25.579
-9.772
-27.64%
jan 1, 2012
29.311
+3.732
14.59%
jan 1, 2013
14.341
-14.97
-51.07%
jan 1, 2014
15.846
+1.505
10.49%
jan 1, 2015
17.497
+1.651
10.42%
Ranking of countries by current statistics by years


Comments: