29
/
en
AIzaSyAYiBZKx7MnpbEhh9jyipgxe19OcubqV5w
April 1, 2024
123415
Ecuador
ECU
true
2
1
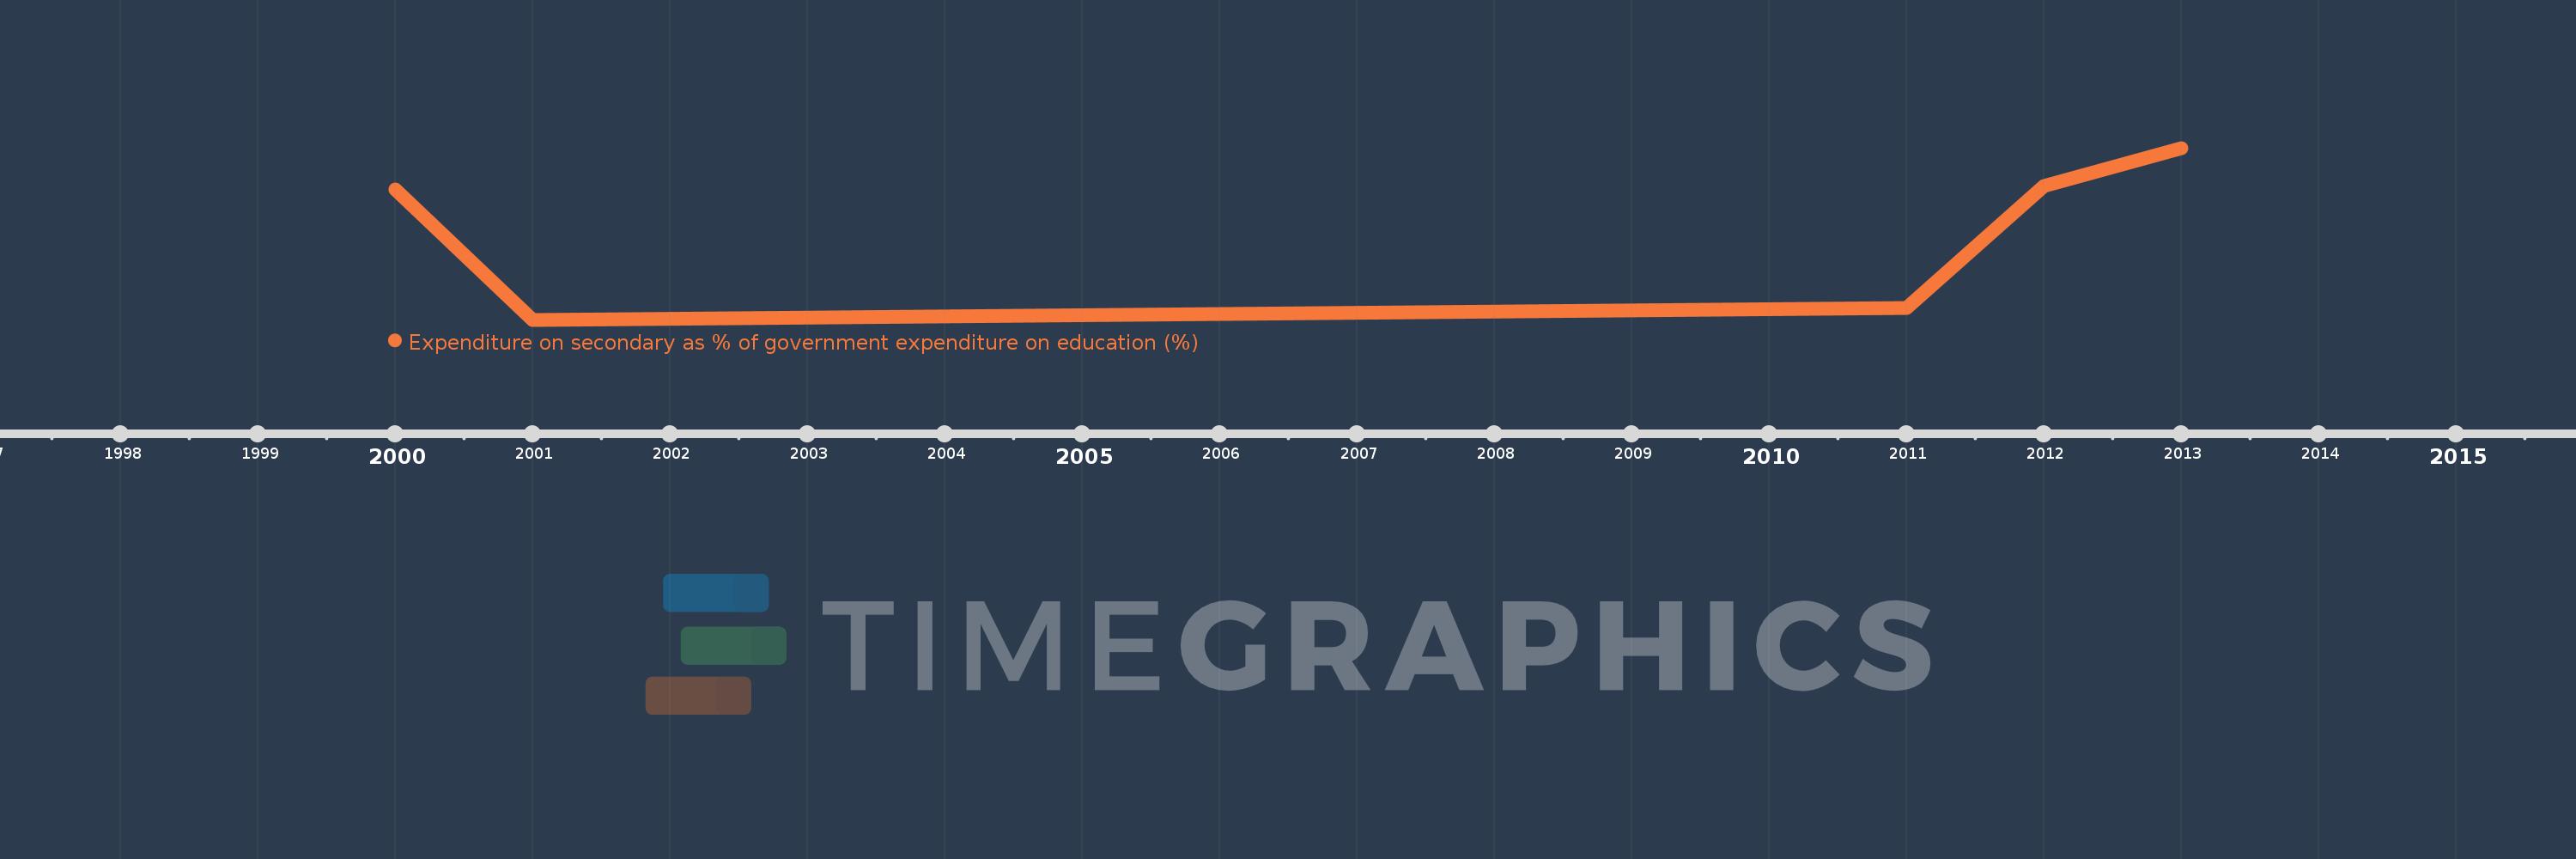
Expenditure on secondary as % of government expenditure on education (%)
2013,2012,2011,2001,2000
This statistics in other country:
Timeline:
This timeline shows a graph from 2000 to 2013 of Ecuador. No data until 1999. Number of actual observations by date: 5.
Source name:
World Development Indicators
Source organization:
UNESCO Institute for Statistics
Categories, topics:
Education
Last updated:
apr 23, 2017
Indicators value changes by year
Minimum:
34.556
jan 1, 2001
Maximum:
41.238
jan 1, 2013
At the date of observation
Value
Absolute change
Change from previous value
jan 1, 2000
39.64
+39.64
0.0%
jan 1, 2001
34.556
-5.084
-12.83%
jan 1, 2011
35.014
+0.458
1.32%
jan 1, 2012
39.761
+4.747
13.56%
jan 1, 2013
41.238
+1.478
3.72%
Ranking of countries by current statistics by years


Comments: