29
/
en
AIzaSyAYiBZKx7MnpbEhh9jyipgxe19OcubqV5w
April 1, 2024
29809
Euro area
EMU
false
2
1
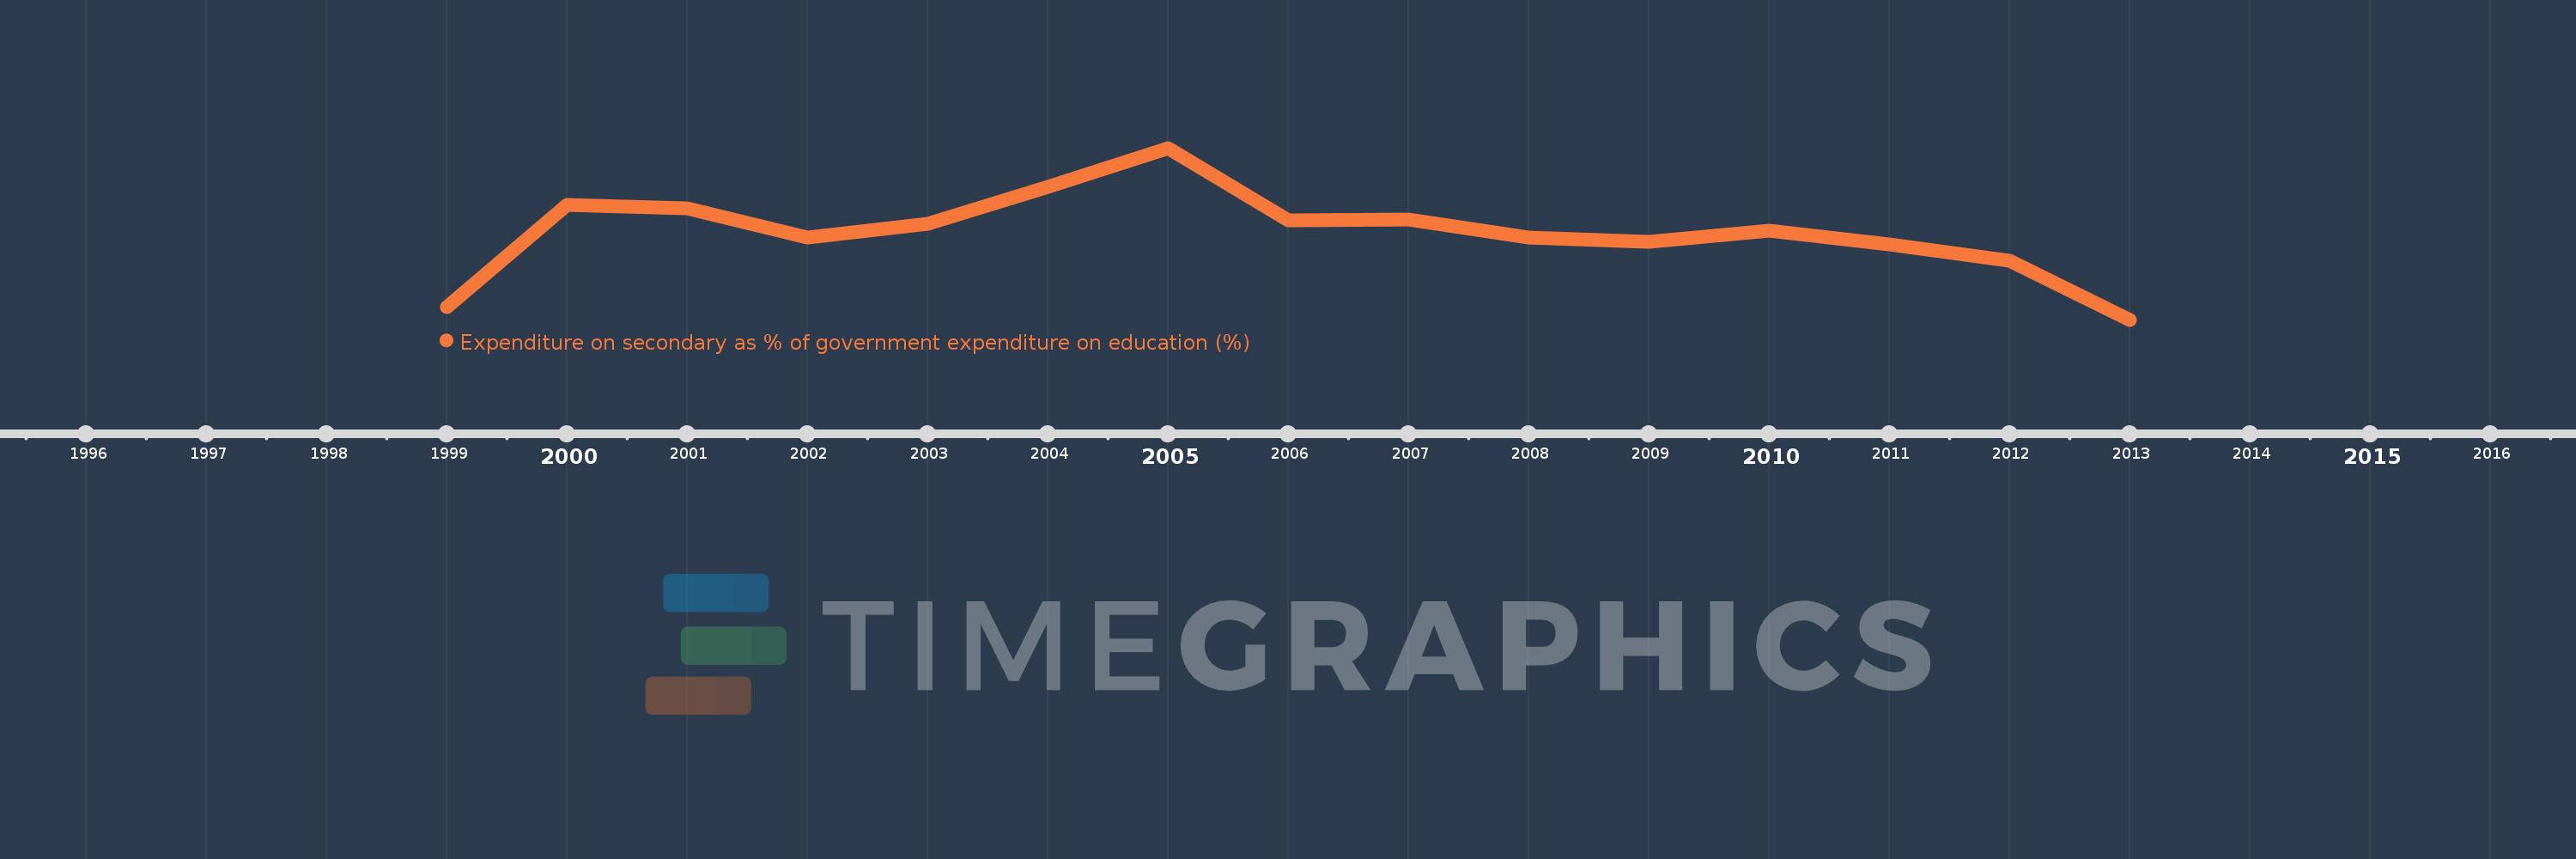
Expenditure on secondary as % of government expenditure on education (%)
2013,2012,2011,2010,2009,2008,2007,2006,2005,2004,2003,2002,2001,2000,1999
This statistics in other country:
Timeline:
This timeline shows a graph from 1999 to 2013 of Euro area. No data until 1998. Number of actual observations by date: 15.
Source name:
World Development Indicators
Source organization:
UNESCO Institute for Statistics
Categories, topics:
Education
Last updated:
apr 23, 2017
Indicators value changes by year
Minimum:
40.531
jan 1, 2013
At the date of observation
Value
Absolute change
Change from previous value
jan 1, 1999
40.896
+40.896
0.0%
jan 1, 2000
43.843
+2.947
7.21%
jan 1, 2001
43.745
-0.099
-0.23%
jan 1, 2002
42.897
-0.847
-1.94%
jan 1, 2003
43.31
+0.413
0.96%
jan 1, 2004
44.374
+1.063
2.46%
jan 1, 2005
45.5
+1.126
2.54%
jan 1, 2006
43.408
-2.092
-4.6%
jan 1, 2007
43.431
+0.023
0.05%
jan 1, 2008
42.916
-0.515
-1.19%
jan 1, 2009
42.796
-0.12
-0.28%
jan 1, 2010
43.112
+0.316
0.74%
jan 1, 2011
42.72
-0.392
-0.91%
jan 1, 2012
42.243
-0.477
-1.12%
jan 1, 2013
40.531
-1.712
-4.05%
Ranking of countries by current statistics by years


Comments: