29
/
en
AIzaSyAYiBZKx7MnpbEhh9jyipgxe19OcubqV5w
April 1, 2024
223481
Philippines
PHL
true
2
1
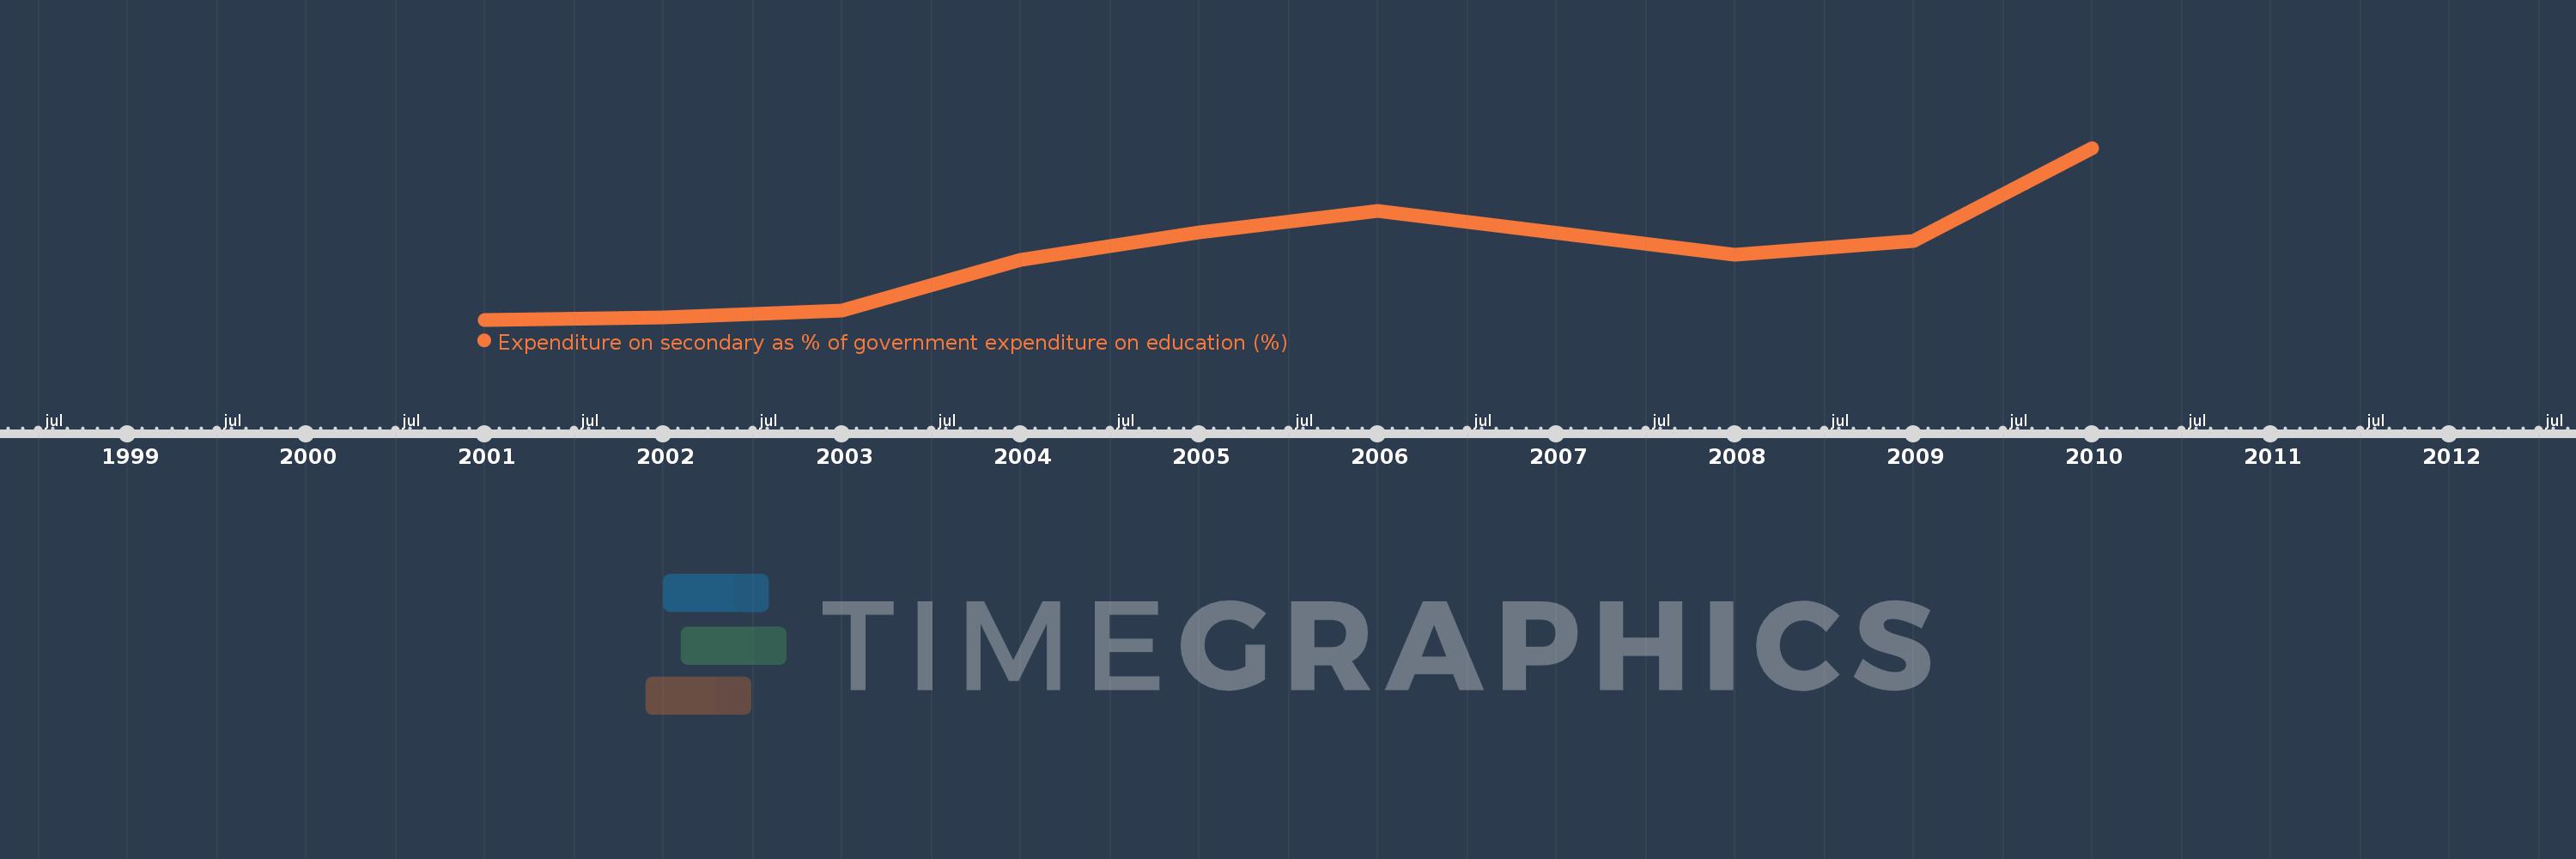
Expenditure on secondary as % of government expenditure on education (%)
2010,2009,2008,2006,2005,2004,2003,2002,2001
This statistics in other country:
Timeline:
This timeline shows a graph from 2001 to 2010 of Philippines. No data until 2000. Number of actual observations by date: 9.
Source name:
World Development Indicators
Source organization:
UNESCO Institute for Statistics
Categories, topics:
Education
Last updated:
apr 23, 2017
Indicators value changes by year
Minimum:
21.806
jan 1, 2001
Maximum:
29.694
jan 1, 2010
At the date of observation
Value
Absolute change
Change from previous value
jan 1, 2001
21.806
+21.806
0.0%
jan 1, 2002
21.922
+0.117
0.53%
jan 1, 2003
22.214
+0.291
1.33%
jan 1, 2004
24.54
+2.327
10.47%
jan 1, 2005
25.836
+1.296
5.28%
jan 1, 2006
26.792
+0.956
3.7%
jan 1, 2008
24.773
-2.019
-7.54%
jan 1, 2009
25.414
+0.641
2.59%
jan 1, 2010
29.694
+4.28
16.84%
Ranking of countries by current statistics by years


Comments: