29
/
en
AIzaSyAYiBZKx7MnpbEhh9jyipgxe19OcubqV5w
April 1, 2024
108447
Comoros
COM
true
2
1
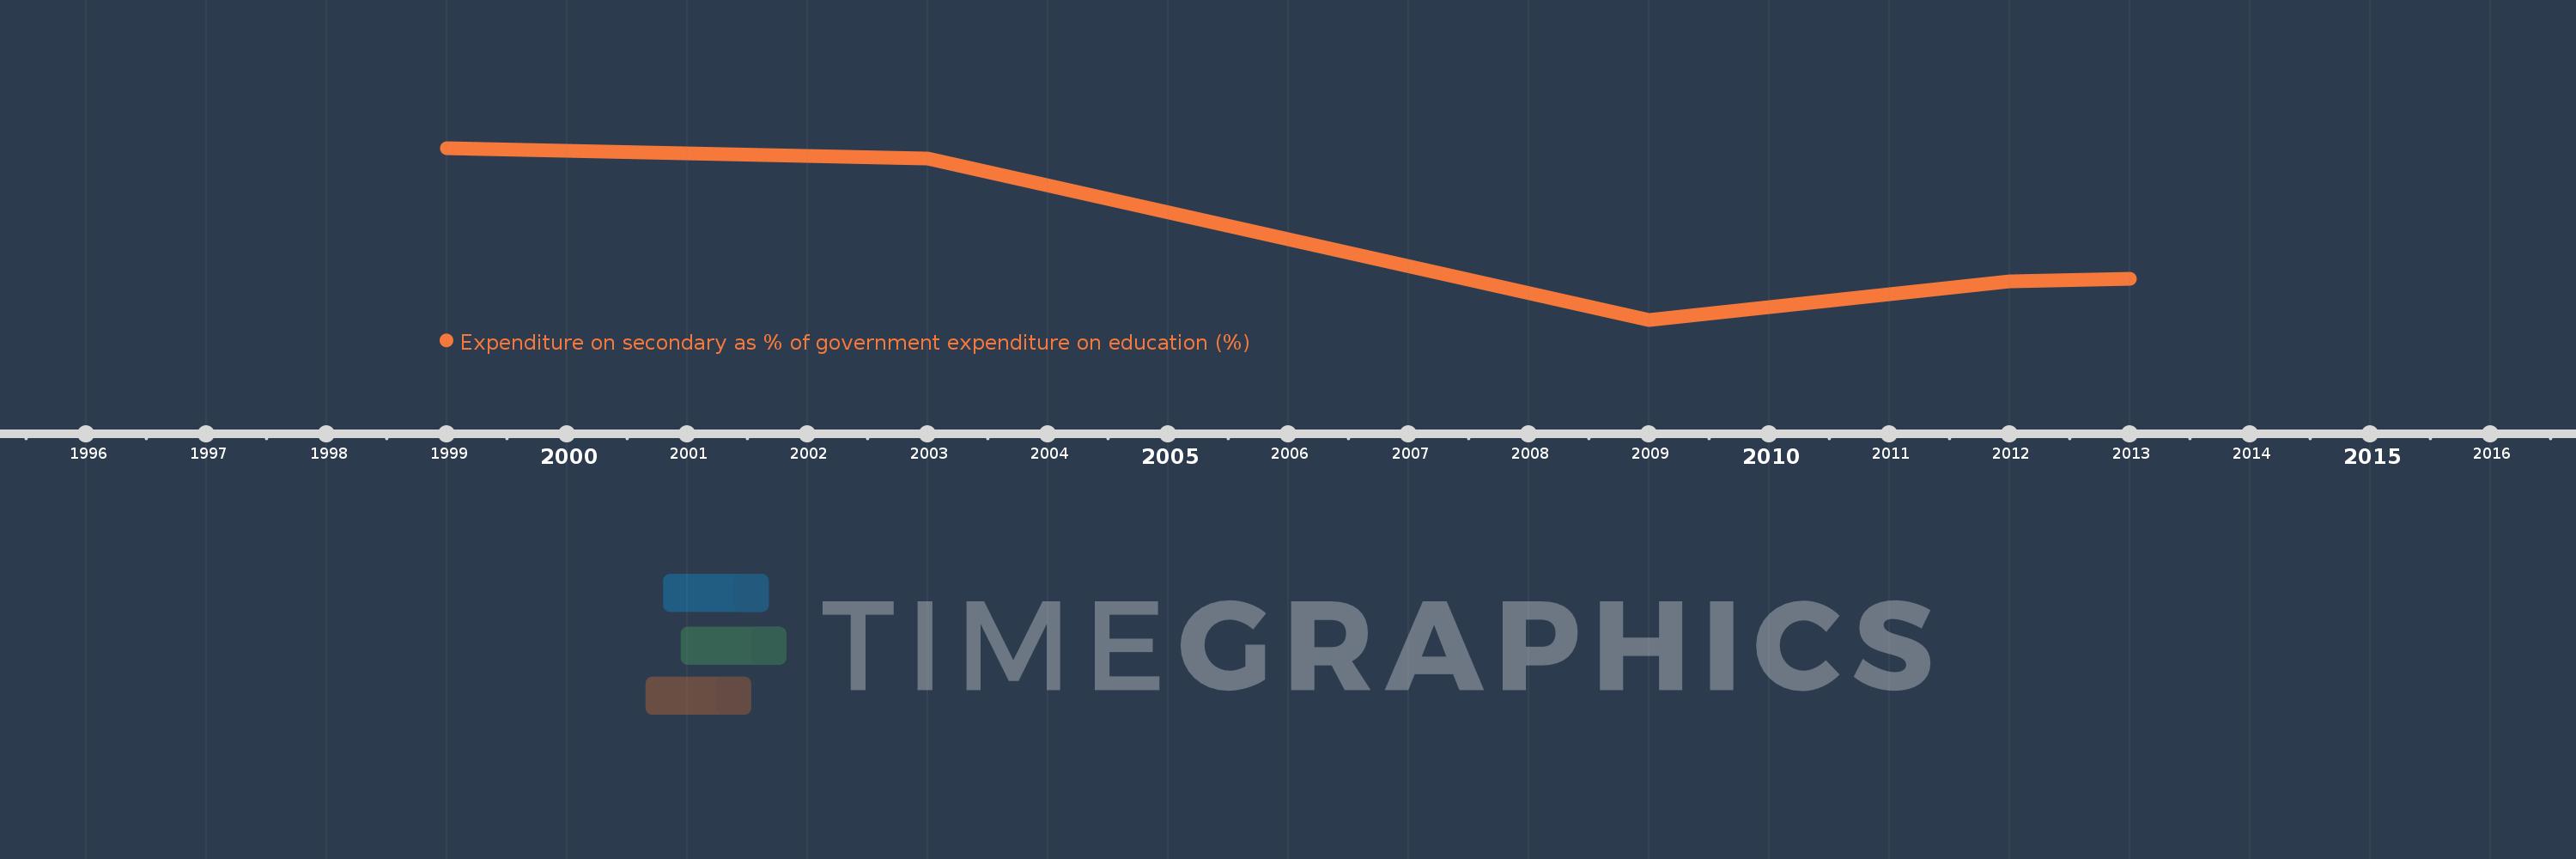
Expenditure on secondary as % of government expenditure on education (%)
2013,2012,2009,2003,1999
This statistics in other country:
Timeline:
This timeline shows a graph from 1999 to 2013 of Comoros. No data until 1998. Number of actual observations by date: 5.
Source name:
World Development Indicators
Source organization:
UNESCO Institute for Statistics
Categories, topics:
Education
Last updated:
apr 23, 2017
Indicators value changes by year
Minimum:
23.664
jan 1, 2009
Maximum:
41.213
jan 1, 1999
At the date of observation
Value
Absolute change
Change from previous value
jan 1, 1999
41.213
+41.213
0.0%
jan 1, 2003
40.12
-1.093
-2.65%
jan 1, 2009
23.664
-16.457
-41.02%
jan 1, 2012
27.598
+3.935
16.63%
jan 1, 2013
27.831
+0.233
0.84%
Ranking of countries by current statistics by years


Comments: