29
/
en
AIzaSyAYiBZKx7MnpbEhh9jyipgxe19OcubqV5w
April 1, 2024
222100
Peru
PER
true
2
1
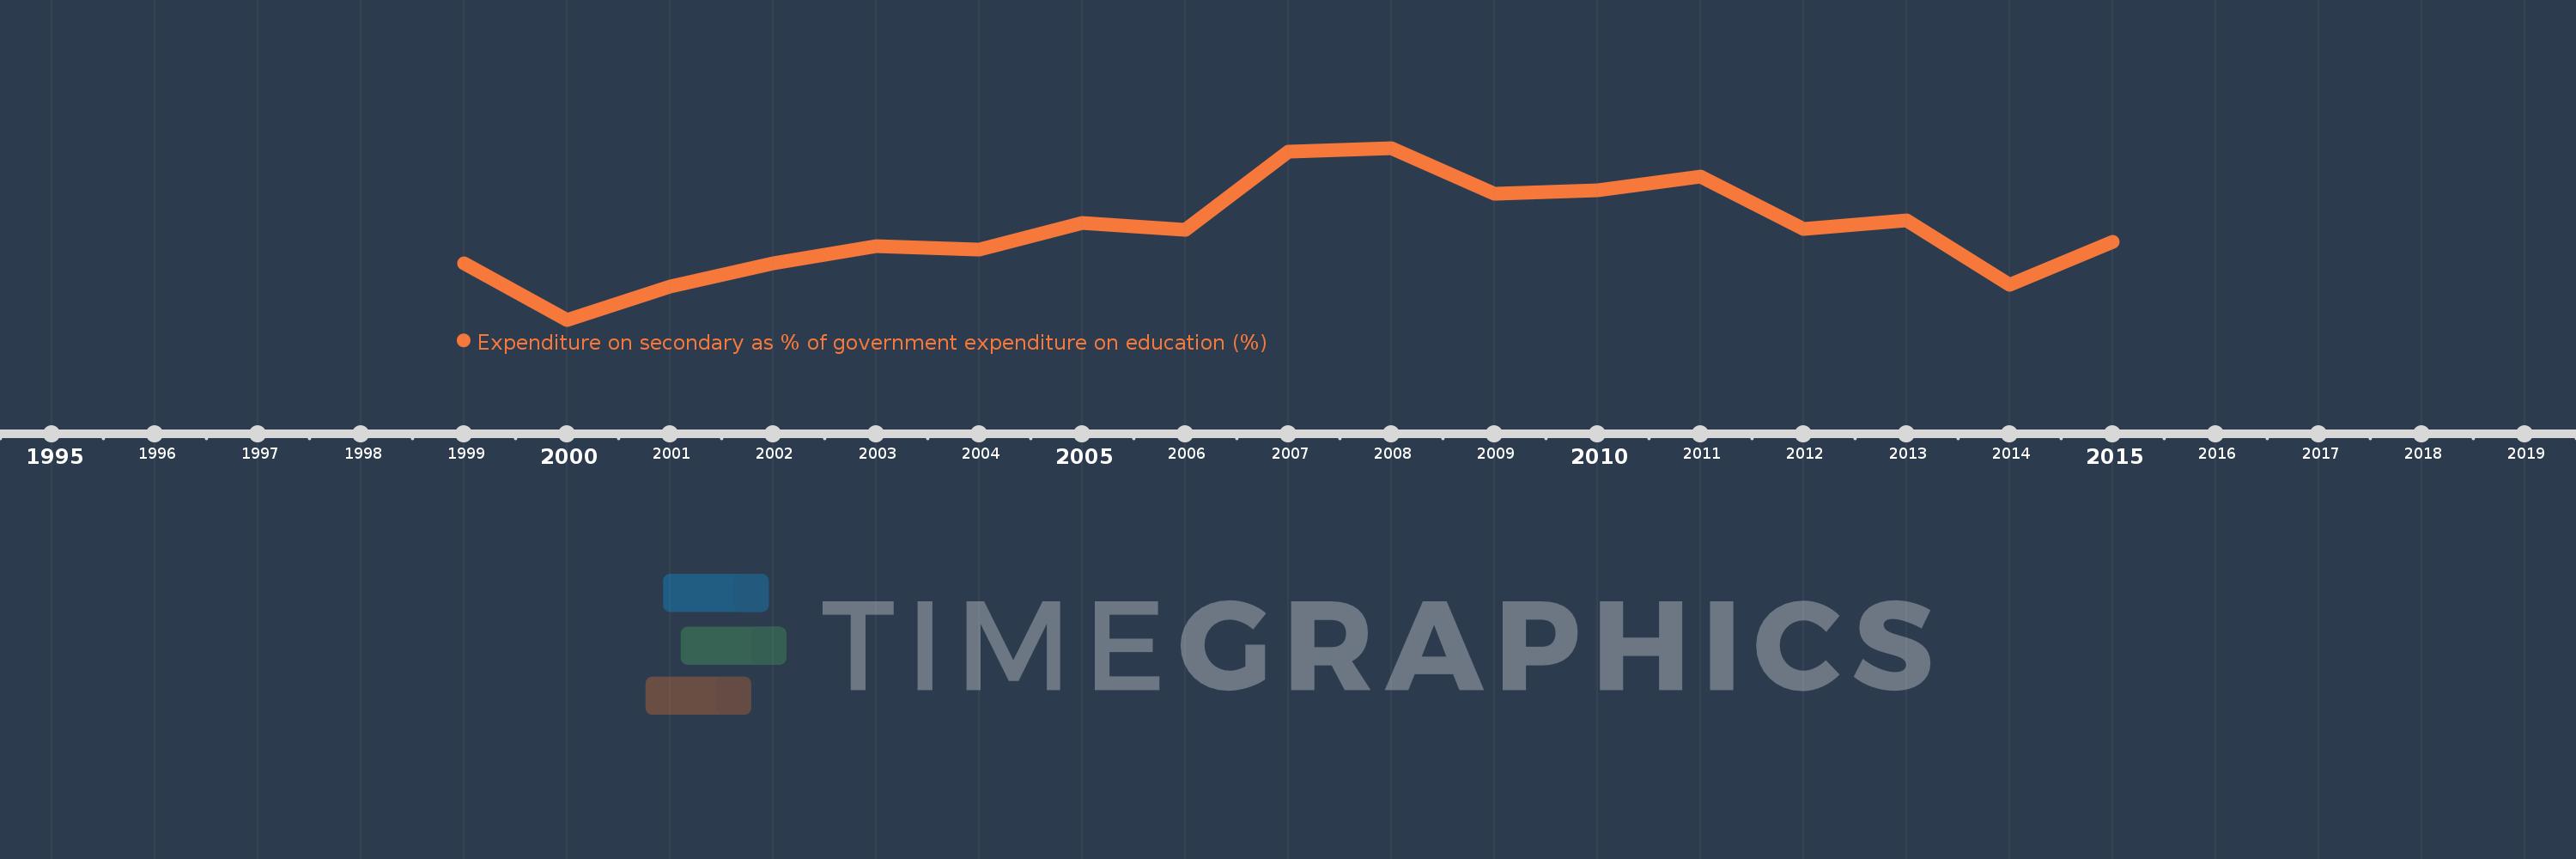
Expenditure on secondary as % of government expenditure on education (%)
2015,2014,2013,2012,2011,2010,2009,2008,2007,2006,2005,2004,2003,2002,2001,2000,1999
This statistics in other country:
Timeline:
This timeline shows a graph from 1999 to 2015 of Peru. No data until 1998. Number of actual observations by date: 17.
Source name:
World Development Indicators
Source organization:
UNESCO Institute for Statistics
Categories, topics:
Education
Last updated:
apr 23, 2017
Indicators value changes by year
Minimum:
26.611
jan 1, 2000
Maximum:
35.713
jan 1, 2008
At the date of observation
Value
Absolute change
Change from previous value
jan 1, 1999
29.58
+29.58
0.0%
jan 1, 2000
26.611
-2.969
-10.04%
jan 1, 2001
28.379
+1.768
6.64%
jan 1, 2002
29.59
+1.211
4.27%
jan 1, 2003
30.493
+0.903
3.05%
jan 1, 2004
30.312
-0.181
-0.59%
jan 1, 2005
31.758
+1.446
4.77%
jan 1, 2006
31.386
-0.372
-1.17%
jan 1, 2007
35.504
+4.119
13.12%
jan 1, 2008
35.713
+0.208
0.59%
jan 1, 2009
33.302
-2.411
-6.75%
jan 1, 2010
33.478
+0.177
0.53%
jan 1, 2011
34.215
+0.737
2.2%
jan 1, 2012
31.405
-2.81
-8.21%
jan 1, 2013
31.868
+0.463
1.47%
jan 1, 2014
28.486
-3.382
-10.61%
jan 1, 2015
30.718
+2.232
7.83%
Ranking of countries by current statistics by years


Comments: