29
/
en
AIzaSyAYiBZKx7MnpbEhh9jyipgxe19OcubqV5w
April 1, 2024
260814
Tanzania
TZA
true
2
1
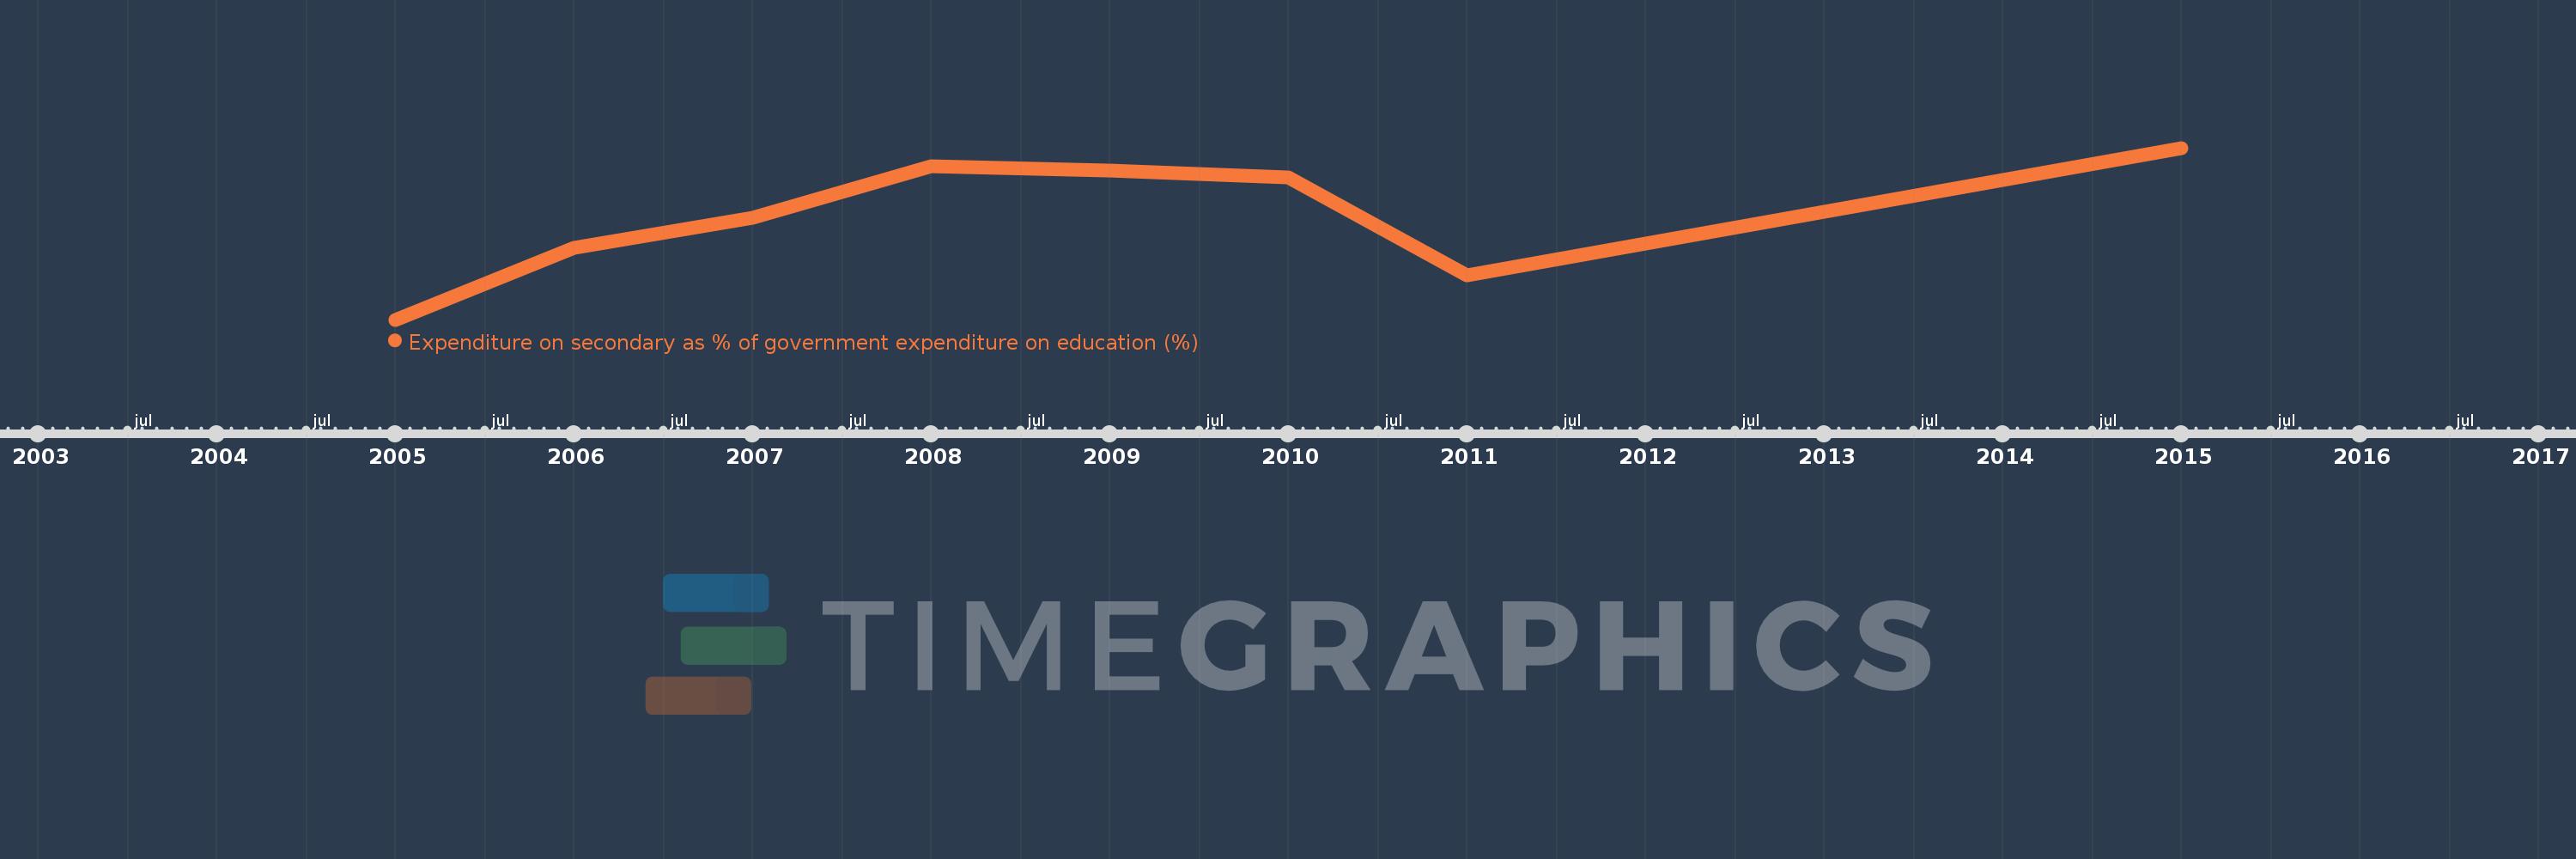
Expenditure on secondary as % of government expenditure on education (%)
2015,2011,2010,2009,2008,2007,2006,2005
This statistics in other country:
Timeline:
This timeline shows a graph from 2005 to 2015 of Tanzania. No data until 2004. Number of actual observations by date: 8.
Source name:
World Development Indicators
Source organization:
UNESCO Institute for Statistics
Categories, topics:
Education
Last updated:
apr 23, 2017
Indicators value changes by year
Maximum:
18.268
jan 1, 2015
At the date of observation
Value
Absolute change
Change from previous value
jan 1, 2005
8.93
+8.93
0.0%
jan 1, 2006
12.851
+3.922
43.92%
jan 1, 2007
14.454
+1.602
12.47%
jan 1, 2008
17.257
+2.803
19.39%
jan 1, 2009
17.026
-0.231
-1.34%
jan 1, 2010
16.661
-0.366
-2.15%
jan 1, 2011
11.324
-5.336
-32.03%
jan 1, 2015
18.268
+6.944
61.32%
Ranking of countries by current statistics by years


Comments: